Skip to content
cropped-economygdp.jpg

Economy GDP

World economy charts, business frameworks and diagrams

Menu

Primary menu

  • Economy
    • Top Economies
  • Demographics
  • Business
    • Strategy
    • Project Management
    • Industry Examples
    • Leadership
    • HR
    • Industry Examples
  • Framework
  • Analysis
  • Lean Six Sigma
    • Lean
  • IT
    • Social Media
  • Marketing
  • Stories
  • Top

Tag Archives: India statistics

India Fertility Rate

India Fertility Rate

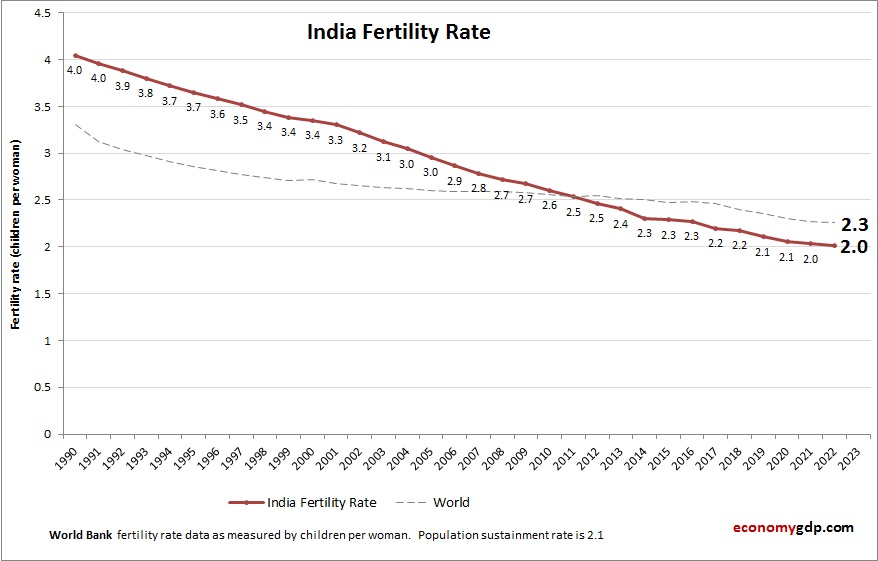
This diagram presents India Fertility Rate. This is according to World Bank birth stats by country. Based on the latest demographics info provided for India. India’s fertility rate is declining steadily due to government family planning programs, urbanization, and rising View diagram India Fertility Rate→

Posted in Demographics | Tagged India demographics, India statistics

India GDP Purchasing Power Parity

India GDP Purchasing Power Parity

India economy graph showing purchasing power parity (PPP) growth from 2000 to today. Purchasing power parity adjusts the size of the economy to relevant price levels, i.e. measuring the price of specific goods in different countries and adjusting GDP accordingly. View diagram India GDP Purchasing Power Parity→

Posted in Economy | Tagged India, India economy, India gdp, India statistics

Primary Sidebar Widget Area

Top Diagrams

Latest Posts

  • Lower middle income Children Per woman
  • Belarus GDP Purchasing Power Parity
  • Portugal GDP per capita
  • Kuwait Children Per woman
  • Montenegro GDP Purchasing Power Parity
  • Peru GDP
  • Syria Economy in Graphs
  • Algeria GDP Purchasing Power Parity
  • Customer Journey Map/Sales Customer Journey Map
  • Quantitative Data Analysis Methods
  • Marshall Plan Postwar Economic Recovery
  • Equatorial Guinea GDP PPP
  • Latvia GDP PPP
  • Business Model Framework PPT Slide
  • End of Bretton Woods 1971: Rise of Fiat Currency
  • Twitter
Copyright © 2026 Economy GDP. All Rights Reserved.
Theme: Catch Box by Catch Themes
Scroll Up