Skip to content
cropped-economygdp.jpg

Economy GDP

World economy charts, business frameworks and diagrams

Menu

Primary menu

  • Economy
    • Top Economies
  • Demographics
  • Business
    • Strategy
    • Project Management
    • Industry Examples
    • Leadership
    • HR
    • Industry Examples
  • Framework
  • Analysis
  • Lean Six Sigma
    • Lean
  • IT
    • Social Media
  • Marketing
  • Stories
  • Top

Tag Archives: IDA total gdp

IDA total GDP growth rate

IDA total GDP growth rate

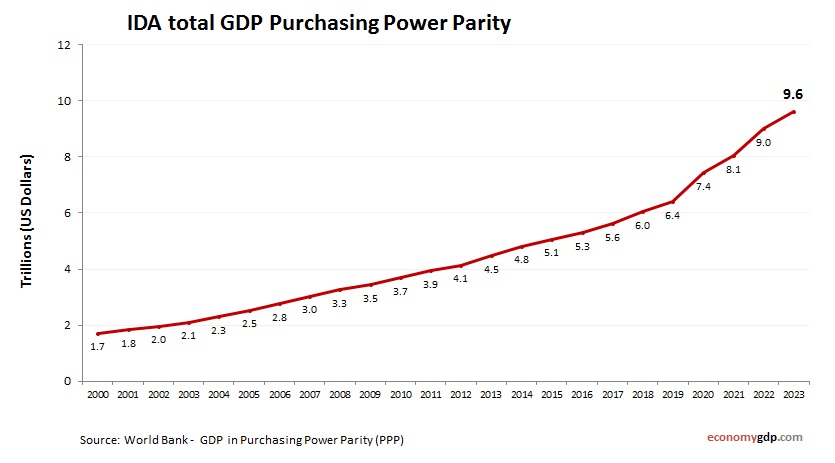
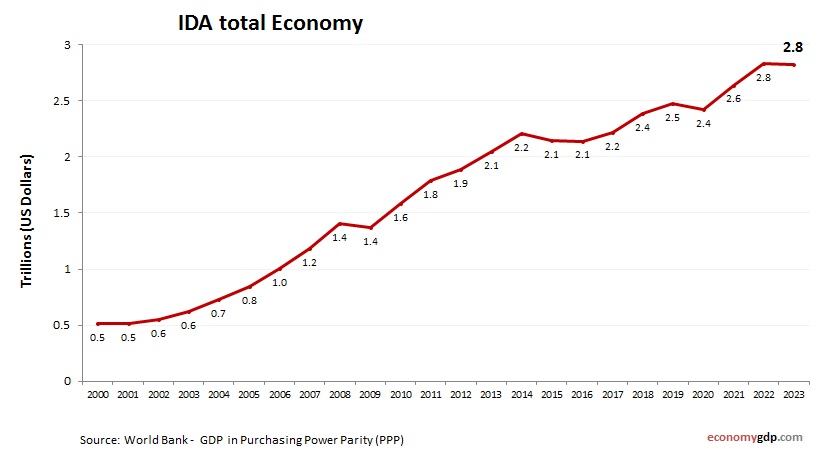
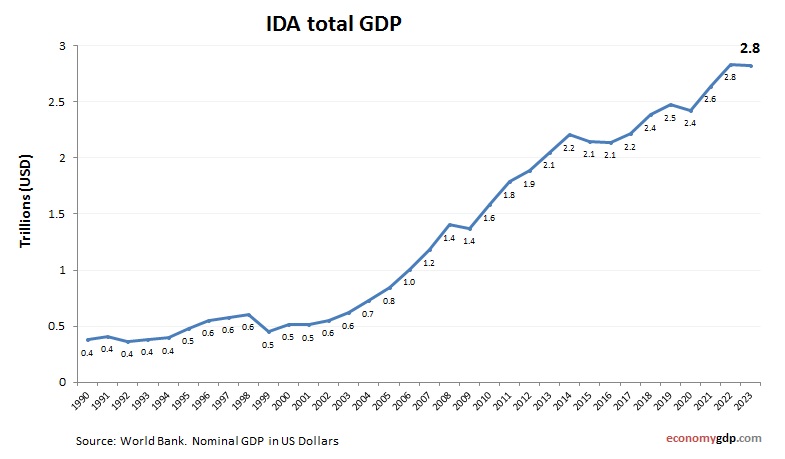
IDA total economy annual growth rate from 2000 to today. GDP growth (yearly %). World Bank and OECD national accounts data. The International Development Association (IDA) group of countries experienced GDP growth of approximately 3.5% in 2023. Growth was driven View diagram IDA total GDP growth rate→

Posted in Economy | Tagged IDA total economy, IDA total gdp

IDA total GDP PPP

IDA total GDP PPP

IDA total economy graph showing purchasing power parity (PPP) growth from 1990 to today. Purchasing power parity adjusts the size of the economy to relevant price levels, i.e. measuring the price of specific goods in different countries and adjusting GDP View diagram IDA total GDP PPP→

Posted in Economy | Tagged IDA total economy, IDA total gdp

IDA total GDP Purchasing Power Parity

IDA total GDP Purchasing Power Parity

IDA total economy graph showing purchasing power parity (PPP) growth from 2000 to today. Purchasing power parity adjusts the size of the economy to relevant price levels, i.e. measuring the price of specific goods in different countries and adjusting GDP View diagram IDA total GDP Purchasing Power Parity→

Posted in Economy | Tagged IDA total economy, IDA total gdp

IDA total Economy

IDA total Economy

IDA total economy growth from 2000 to today. GDP (current US$). World Bank and OECD national accounts data. The total economy of IDA countries is small relative to global standards. These countries are typically in early development stages, with growth View diagram IDA total Economy→

Posted in Economy | Tagged IDA total economy, IDA total gdp

IDA total GDP

IDA total GDP

IDA total GDP from 1990 to today. World Bank and OECD data. GDP in US dollars. The total GDP of IDA countries is relatively low, as it comprises the world’s poorest nations. These economies are largely agrarian and dependent on View diagram IDA total GDP→

Posted in Economy | Tagged IDA total economy, IDA total gdp

Primary Sidebar Widget Area

Top Diagrams

Latest Posts

  • Business Capabilities Model Explained
  • Paraguay GDP
  • Puerto Rico GDP per capita
  • Customer Segmentation Model
  • South Sudan GDP PPP
  • Paraguay GDP per capita
  • Tuvalu GDP per capita
  • Fraud Triangle
  • Togo GDP PPP
  • St. Kitts and Nevis GDP Purchasing Power Parity
  • AI Use Cases in Marketing Automation
  • Ukraine GDP
  • British East India Company 1600: Trade and Empire
  • Honduras Inflation
  • Macedonia GDP PPP
  • Twitter
Copyright © 2025 Economy GDP. All Rights Reserved.
Theme: Catch Box by Catch Themes
Scroll Up