
Serbias PPP GDP was $165.5 billion in 2023. Manufacturing, agriculture, and services dominate, with GDP per capita (PPP) at $24,000. EU integration boosts trade, but corruption and brain drain challenge growth. Infrastructure and energy sectors are key for progress.
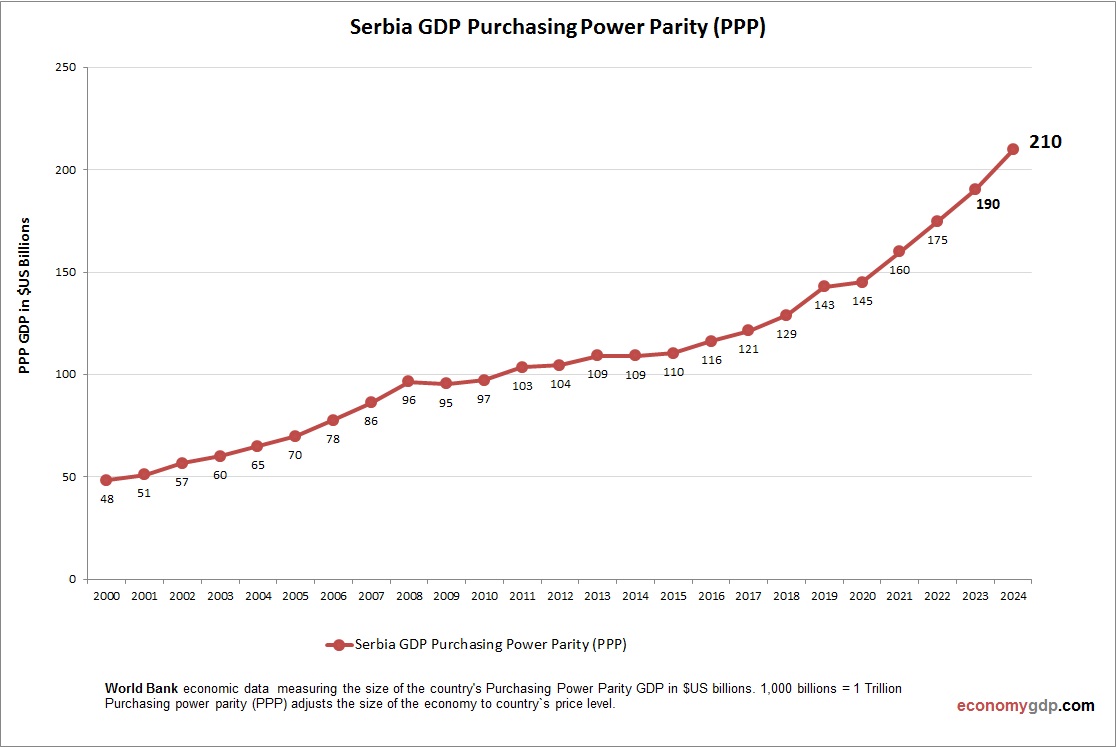
Serbia GDP PPP Statistics by Year
| Year | GDP, Purchasing Power Parity (PPP) |
| 2000 | 48.2 |
| 2001 | 51.0 |
| 2002 | 56.7 |
| 2003 | 60.0 |
| 2004 | 65.0 |
| 2005 | 69.9 |
| 2006 | 77.5 |
| 2007 | 86.3 |
| 2008 | 96.5 |
| 2009 | 95.4 |
| 2010 | 97.1 |
| 2011 | 103.5 |
| 2012 | 104.5 |
| 2013 | 109.3 |
| 2014 | 109.1 |
| 2015 | 110.3 |
| 2016 | 116.1 |
| 2017 | 121.4 |
| 2018 | 129.0 |
| 2019 | 143.0 |
| 2020 | 145.0 |
| 2021 | 160.0 |
| 2022 | 174.2 |
| 2023 | 197.2 |
| 2024 | 216.2 |
| 2025 (Est.) | 230.0 |
| 2026 (Est.) | 245.0 |