
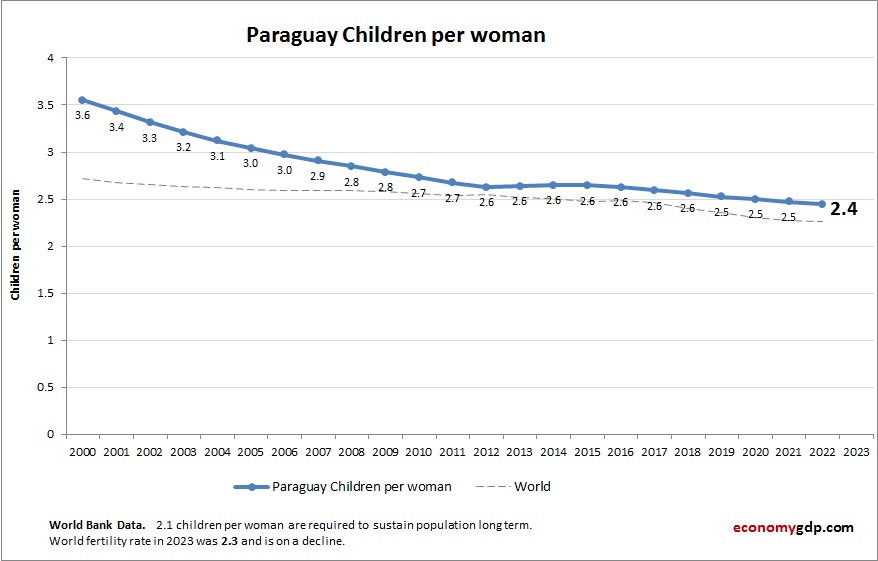
Chart above demonstrates Paraguay Children Per woman. The fertility rate statistics are compiled by World Bank. Latest births per woman information for Paraguay.
Paraguay has a moderate children per woman rate, trending downward. Access to education and urban migration are changing reproductive norms.
Paraguay Children Per woman (Fertility Rate) Statistics by Year
| Year | Children per woman (fertility rate) |
| 2000 | 3.51 |
| 2001 | 3.36 |
| 2002 | 3.23 |
| 2003 | 3.12 |
| 2004 | 3.05 |
| 2005 | 2.97 |
| 2006 | 2.89 |
| 2007 | 2.82 |
| 2008 | 2.79 |
| 2009 | 2.76 |
| 2010 | 2.70 |
| 2011 | 2.67 |
| 2012 | 2.66 |
| 2013 | 2.64 |
| 2014 | 2.65 |
| 2015 | 2.65 |
| 2016 | 2.62 |
| 2017 | 2.59 |
| 2018 | 2.56 |
| 2019 | 2.53 |
| 2020 | 2.50 |
| 2021 | 2.47 |
| 2022 | 2.44 |
| 2023 | 2.42 |
| 2024 | 2.42 |
| 2025 (Est.) | 2.40 |
| 2026 (Est.) | 2.40 |