Customer Experience Flowchart

Customer Experience Flowchart

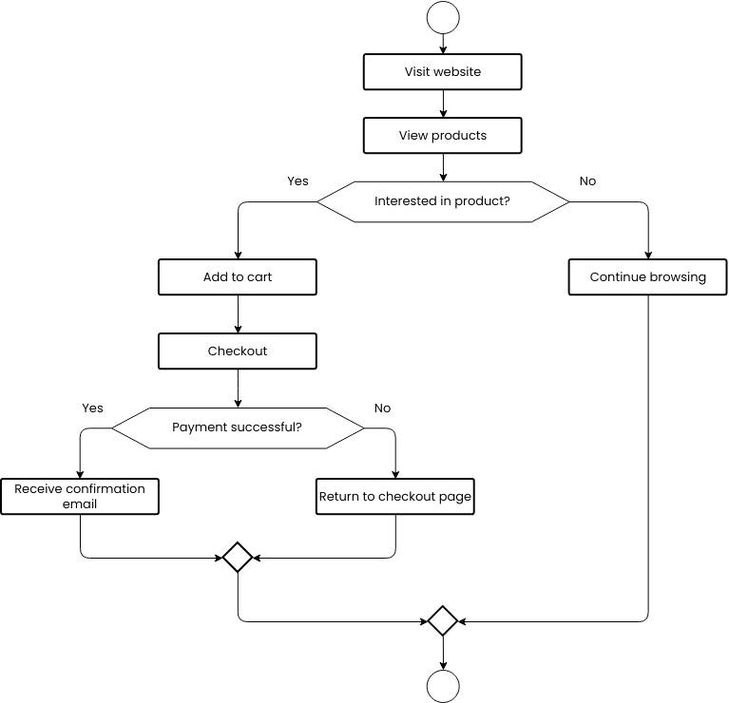
Customer Experience Flowchart: A customer experience flowchart visually maps out the interactions a customer has with a business, from initial contact through to post-purchase. It outlines key touchpoints, such as website navigation, customer service interactions, and product delivery, helping businesses View diagram Customer Experience Flowchart

Customer Segmentation Illustration

Customer Segmentation Illustration

Customer Segmentation Illustration: A customer segmentation illustration visually depicts the process of categorizing customers based on specific characteristics, such as purchasing behavior, demographics, or needs. These illustrations often use graphs, charts, or infographics to show how different customer groups interact View diagram Customer Segmentation Illustration

Guyana Fertility Rate

Guyana Fertility Rate

Chart above demonstrates Guyana Fertility Rate. This is according to World Bank birth stats by country. Based on the latest demographics info provided for Guyana. Guyana’s fertility rate is moderate, reflecting improvements in education and healthcare alongside cultural influences favoring View diagram Guyana Fertility Rate

Six Sigma Methodology Process Improvement Risk Management Templates

Six Sigma Methodology Process Improvement Risk Management Templates

Six Sigma Methodology Process Improvement Risk Management Templates: Six Sigma is a data-driven methodology for process improvement that focuses on identifying and removing the causes of defects in any process. It uses a set of tools and techniques to achieve View diagram Six Sigma Methodology Process Improvement Risk Management Templates