
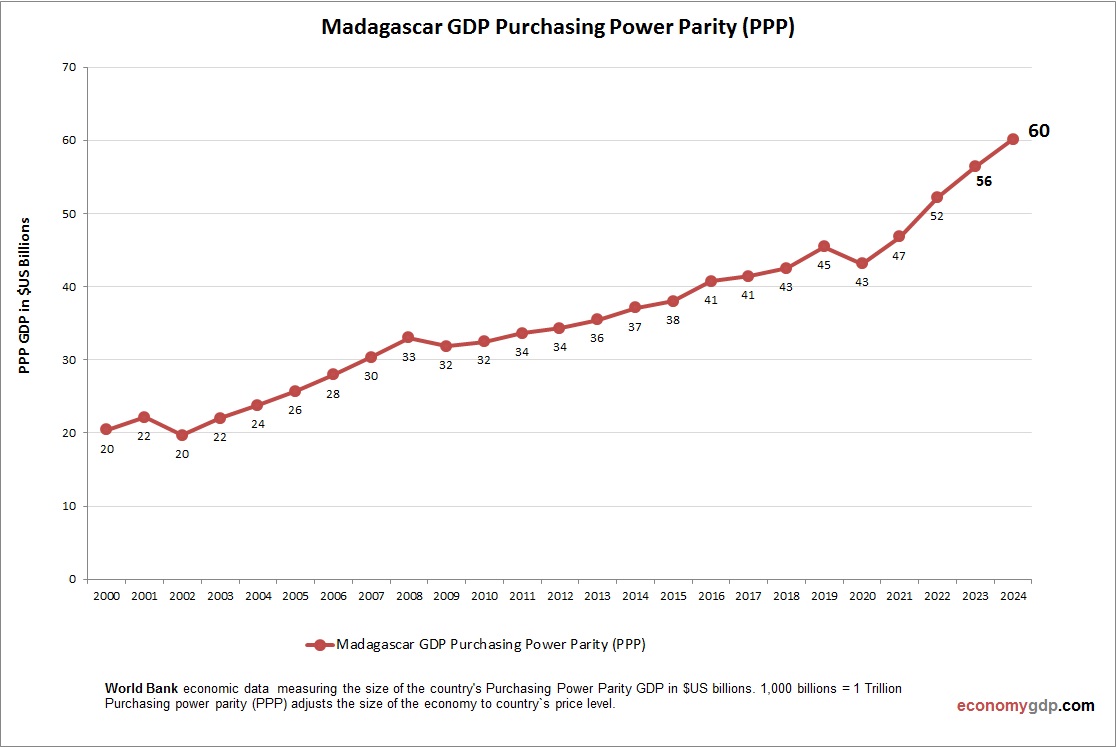
Madagascars PPP GDP was $49.2 billion in 2023. Agriculture (vanilla, rice) and mining drive the economy, with GDP per capita (PPP) at $1,600. Poverty, political instability, and climate risks hinder growth. Tourism and agricultural exports offer potential but require infrastructure.[](https://data.opendatasoft.com/explore/dataset/gdp-ppp-the-world-bank%40kapsarc/)
Madagascar GDP PPP Statistics by Year
| Year | GDP, Purchasing Power Parity (PPP) |
| 2000 | 20.4 |
| 2001 | 22.1 |
| 2002 | 19.7 |
| 2003 | 22.0 |
| 2004 | 23.8 |
| 2005 | 25.7 |
| 2006 | 27.9 |
| 2007 | 30.3 |
| 2008 | 33.0 |
| 2009 | 31.9 |
| 2010 | 32.5 |
| 2011 | 33.7 |
| 2012 | 34.3 |
| 2013 | 35.5 |
| 2014 | 37.1 |
| 2015 | 38.1 |
| 2016 | 40.8 |
| 2017 | 41.4 |
| 2018 | 42.5 |
| 2019 | 45.5 |
| 2020 | 43.2 |
| 2021 | 46.8 |
| 2022 | 52.3 |
| 2023 | 56.4 |
| 2024 | 60.2 |
| 2025 (Est.) | 64.0 |
| 2026 (Est.) | 68.0 |