
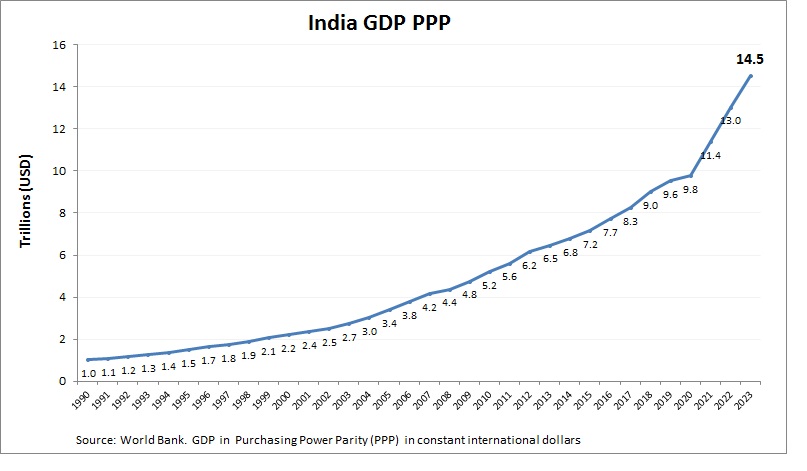
India economy graph showing purchasing power parity (PPP) growth from 2000 to today. Purchasing power parity adjusts the size of the economy to relevant price levels, i.e. measuring the price of specific goods in different countries and adjusting GDP accordingly.
Indias GDP per capita (PPP) is substantial, reflecting its large and diverse economy, though it remains below the global average due to its vast population. India produces a wide range of goods and services, including IT, textiles, pharmaceuticals, and agricultural products. See all India economy graphs.
India GDP PPP Statistics by Year
| Year | GDP, Purchasing Power Parity (PPP) |
| 2000 | 2,212.0 |
| 2001 | 2,370.9 |
| 2002 | 2,499.3 |
| 2003 | 2,749.0 |
| 2004 | 3,046.6 |
| 2005 | 3,391.1 |
| 2006 | 3,777.4 |
| 2007 | 4,177.0 |
| 2008 | 4,388.9 |
| 2009 | 4,763.1 |
| 2010 | 5,230.7 |
| 2011 | 5,618.4 |
| 2012 | 6,162.8 |
| 2013 | 6,497.7 |
| 2014 | 6,812.8 |
| 2015 | 7,204.6 |
| 2016 | 7,795.5 |
| 2017 | 8,354.7 |
| 2018 | 9,230.8 |
| 2019 | 9,932.9 |
| 2020 | 9,771.0 |
| 2021 | 11,384.4 |
| 2022 | 13,124.1 |
| 2023 | 14,845.9 |
| 2024 | 16,192.4 |
| 2025 (Est.) | 17,500.0 |
| 2026 (Est.) | 19,000.0 |