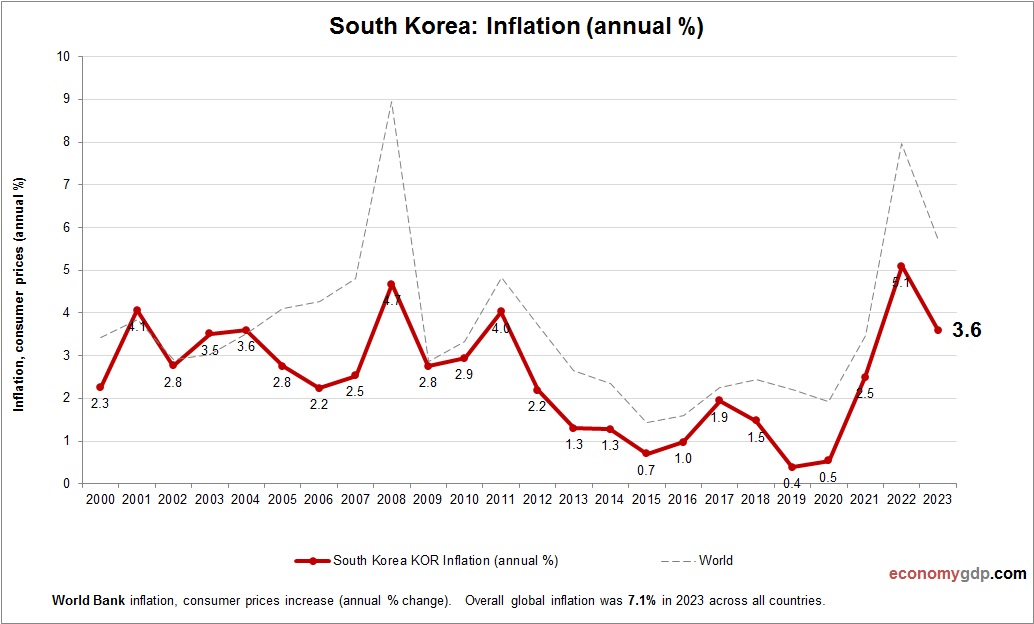
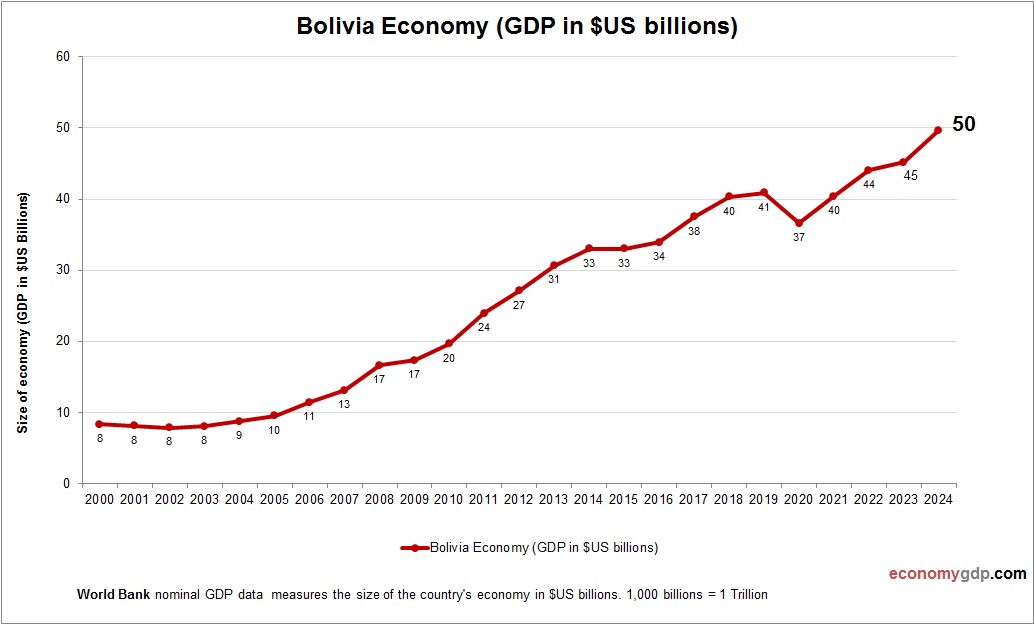
Seychelles Inflation
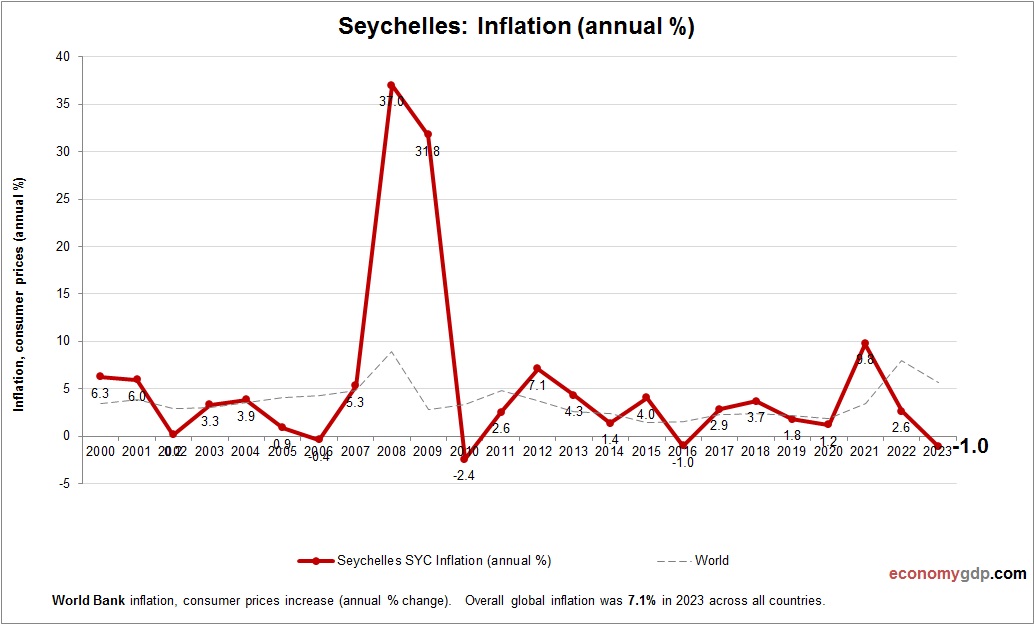
This chart demonstrates Seychelles Inflation. The consumer price statistics are compiled by World Bank. Based on the latest economic data provided for Seychelles. Seychelles faces inflation mainly from high import costs, currency fluctuations, and global tourism trends. As an island View diagram Seychelles Inflation