Suriname GDP growth rate
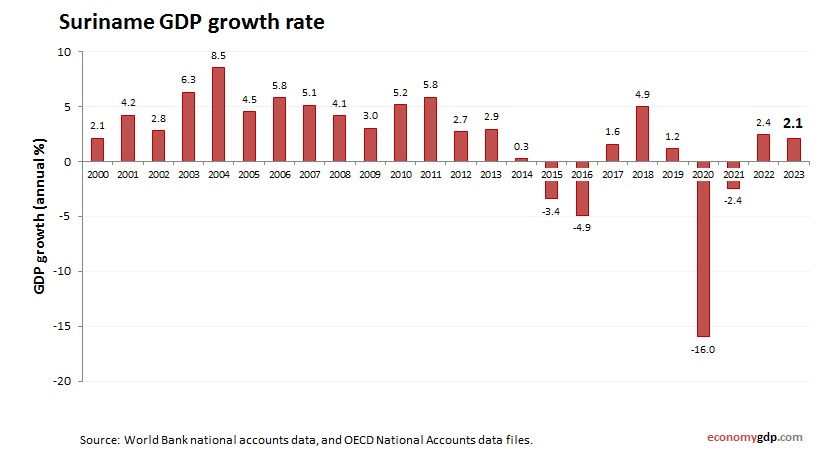
Suriname economy growth rate from 2000 to today. GDP growth (annual %). World Bank and OECD national accounts data. Surinames economy is resource-based, with mining and agriculture playing major roles, alongside efforts to stabilize and diversify the economy.