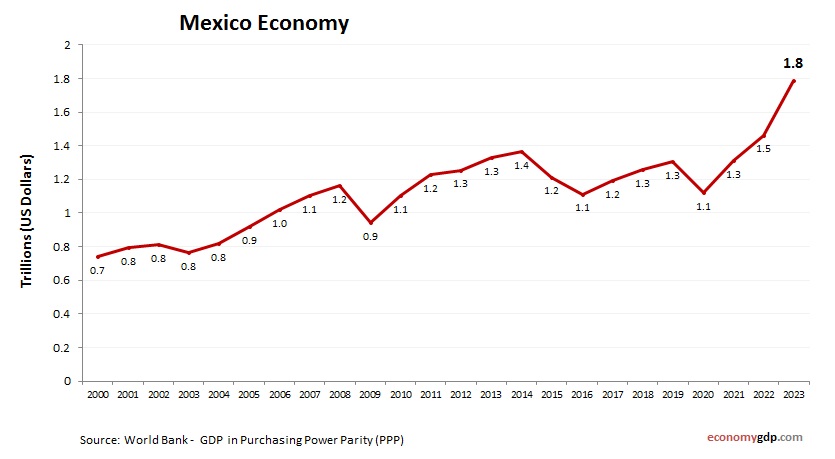
Mexico Economy in Graphs
Mexico’s economy is driven by manufacturing, oil, and agriculture. Automotive and electronics manufacturing, with firms like Ford and Foxconn, thrive due to U.S. trade proximity. Oil production, led by Pemex, remains vital. Agriculture includes avocados and tequila exports. Emerging industries View diagram Mexico Economy in Graphs