Slovakia Economy in Graphs
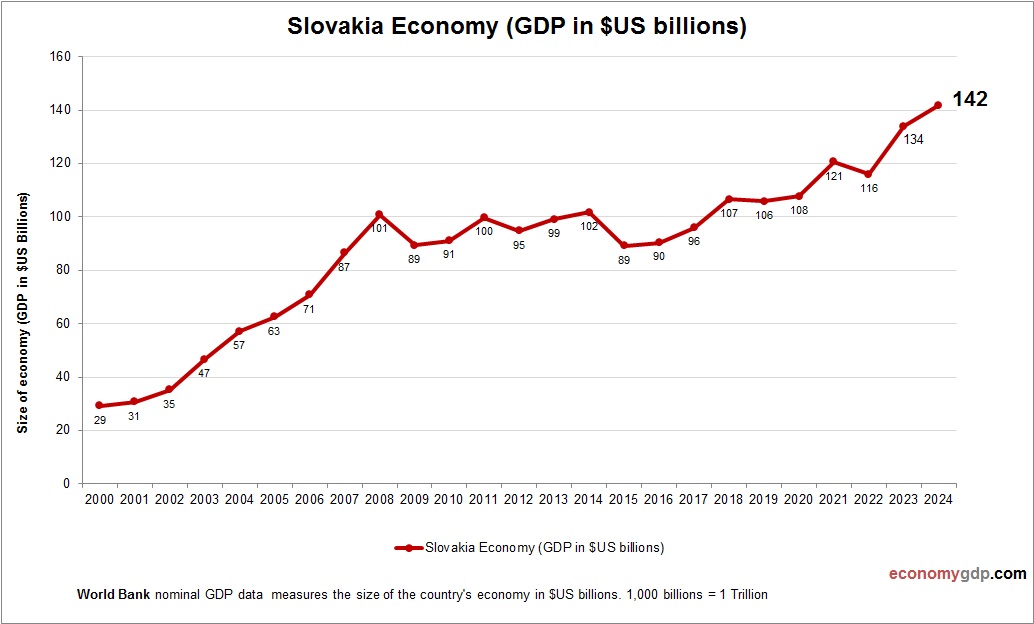
Slovakia’s economy, worth $115 billion, is driven by industry, particularly automotive, with Volkswagen and Kia leading exports. Manufacturing, including electronics, contributes 25% to GDP. Services, notably IT, are growing, with Bratislava as a hub. Agriculture, producing grains, employs 5%. Renewable View diagram Slovakia Economy in Graphs