North Macedonia Inflation
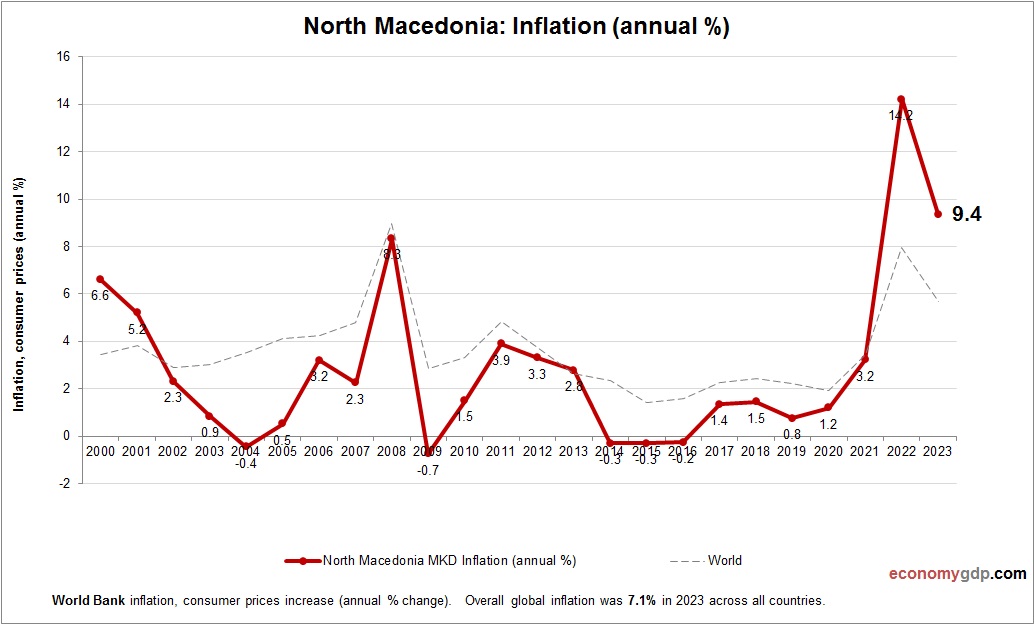
This diagram presents North Macedonia Inflation. The consumer price statistics are compiled by World Bank. Change in consumer prices for North Macedonia. Inflation in North Macedonia is fueled by rising energy and food import prices, currency pressures, and regional trade View diagram North Macedonia Inflation