Nauru GDP per capita
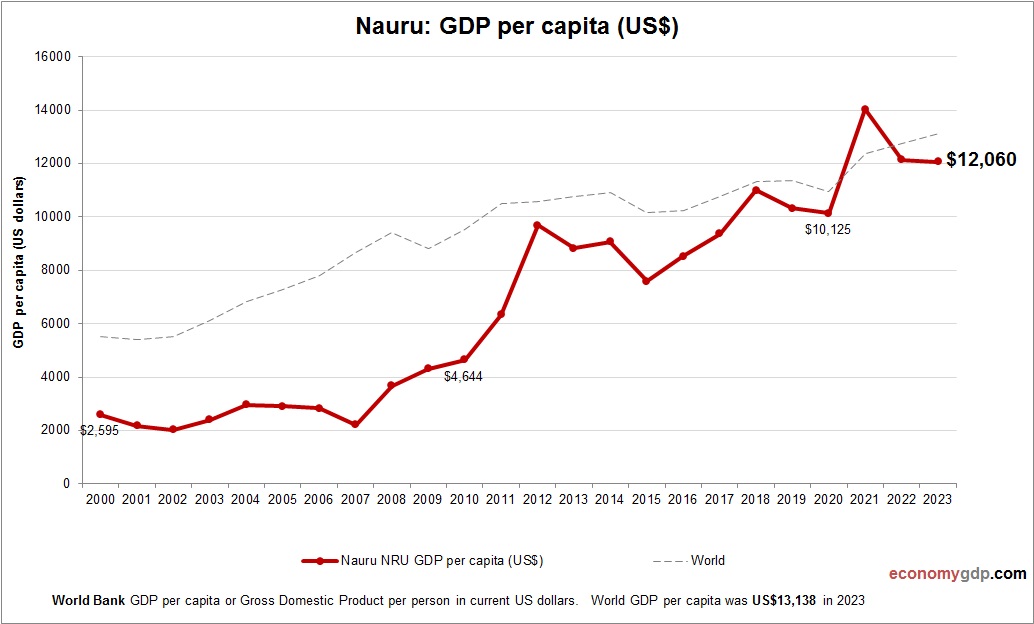
This graph shows Nauru GDP per capita. This is according to World Bank GDP stats by country. Based on the latest available information for Nauru. Nauru’s GDP per capita in 2024 is projected to be around $12,285. The economy has View diagram Nauru GDP per capita