Sudan Fertility Rate
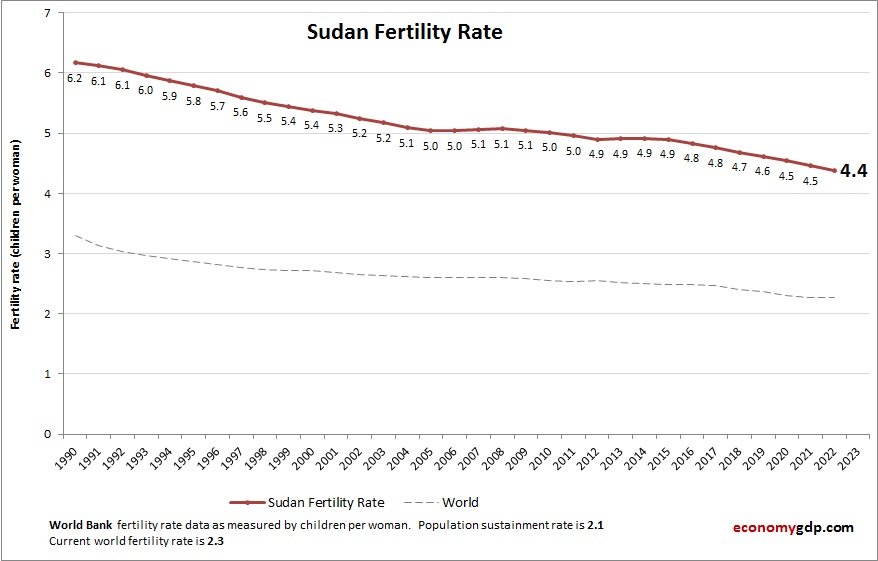
Chart above demonstrates Sudan Fertility Rate. The fertility rate statistics are compiled by World Bank. Based on the latest available information for Sudan. Sudan has a high fertility rate. Conflict, poverty, and traditional family structures contribute to large family sizes, View diagram Sudan Fertility Rate