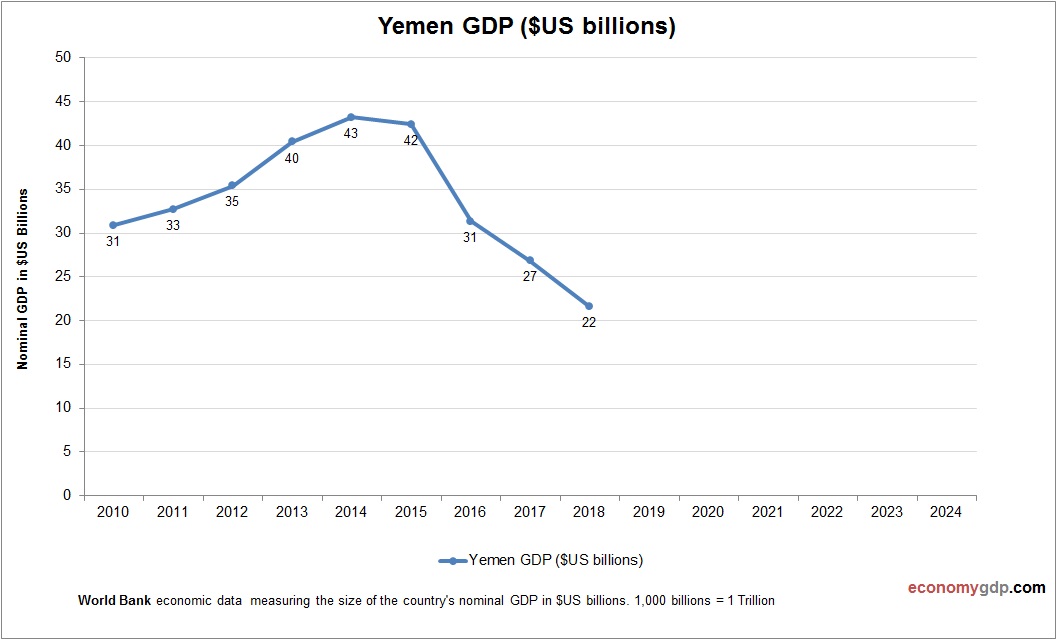
The above graph shows South Asia Children Per woman. This is according to World Bank birth stats by country. Latest births per woman information for South Asia.
Chart above demonstrates Singapore Fertility Rate. The fertility rate statistics are compiled by World Bank. Based on the latest available information for Singapore.
The above graph shows Vanuatu Children Per woman. The fertility rate statistics are compiled by World Bank. Latest births per woman information for Vanuatu.
This chart demonstrates West Bank and Gaza GDP per capita. The economic data is provided by World Bank. Based on the latest economic info provided for West Bank and Gaza.
Chart above demonstrates St. Lucia Fertility Rate. The fertility rate statistics are compiled by World Bank. Based on the latest demographics info provided for St. Lucia.
This graph shows Madagascar Inflation. The consumer price statistics are compiled by World Bank. Based on the latest economic data provided for Madagascar.
The above graph shows Ukraine Children Per woman. This is according to World Bank birth stats by country. Based on the latest available information for Ukraine.