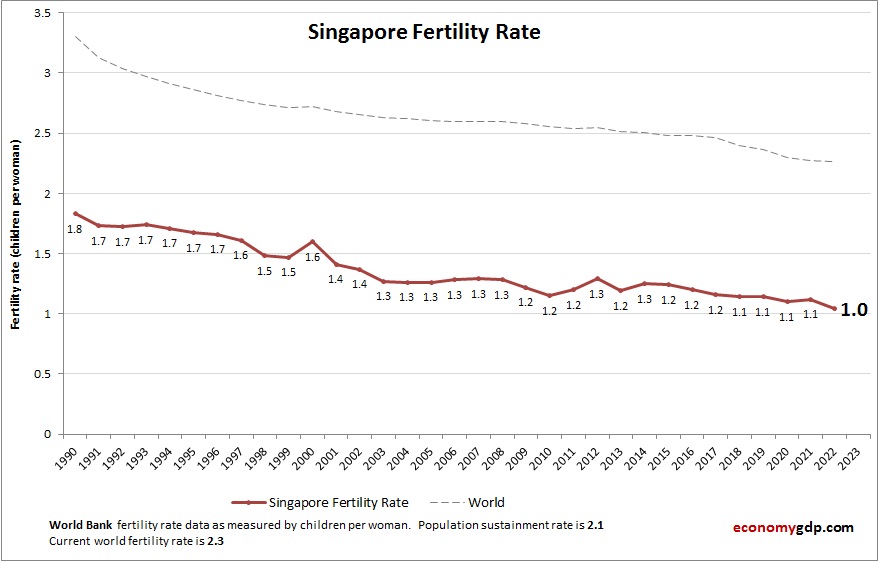
Singapore Children Per woman
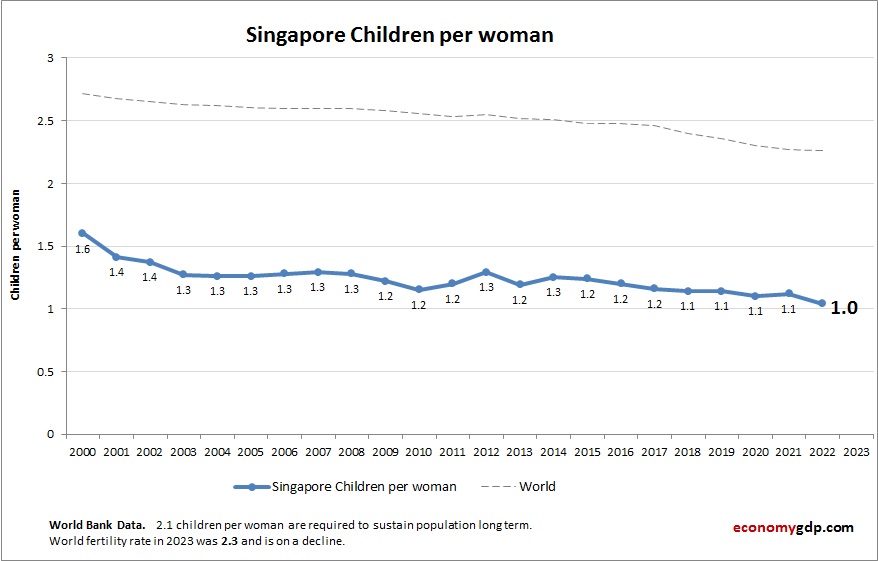
This diagram presents Singapore Children Per woman. The fertility rate statistics are compiled by World Bank. Latest births per woman information for Singapore. Singapore has one of the lowest fertility rates globally, with women having fewer than two children due View diagram Singapore Children Per woman