Sri Lanka Economy in Graphs
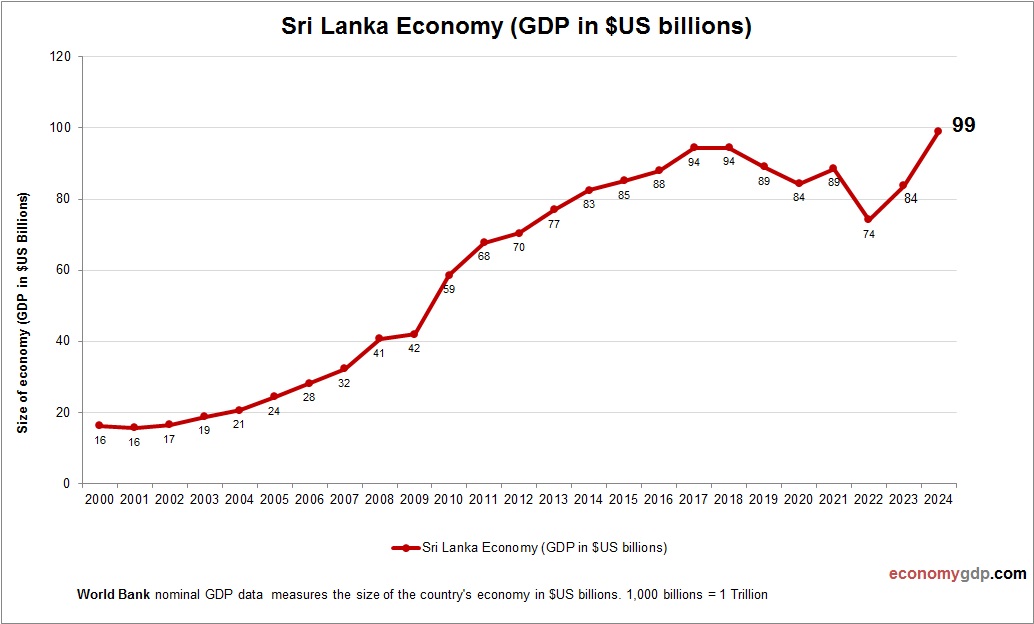
Sri Lanka’s economy, valued at $85 billion, relies on services, particularly tourism, which contributes 10% to GDP, and remittances (8% of GDP). Agriculture, employing 25%, produces tea, rubber, and cinnamon. Textiles drive exports, while IT and fintech are emerging, with View diagram Sri Lanka Economy in Graphs