
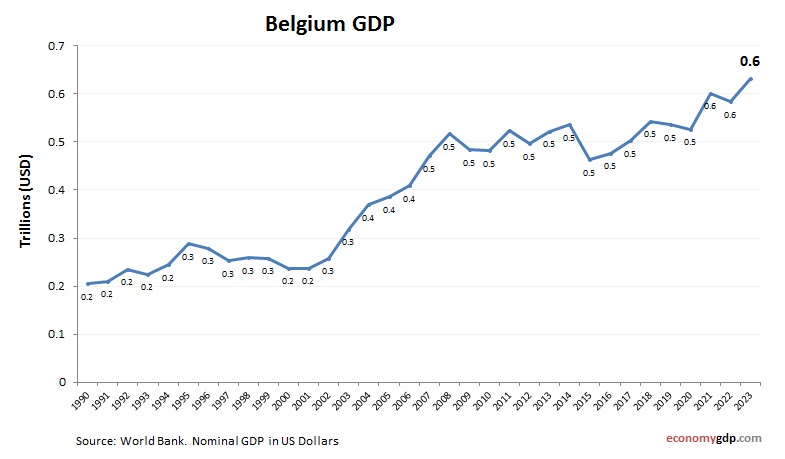
Belgium GDP from 2010 to today. World Bank and OECD data. GDP in US dollars. Belgium's $600 billion economy, growing 1.5% in 2025, leads with logistics, chemicals, and services, boasting a per capita GDP of $52,000. Diamond exports shine, while energy imports rise for its 11.5 million people. Regional disparities and inflation (3%) pose challenges. Recent EU funds drive green ports and digital innovation. Belgium invests in renewable energy and education to enhance competitiveness, targeting carbon neutrality by 2050. Leveraging its EU hub status, it aims for sustainable growth, reducing inequality. With a focus on trade and technology, Belgium navigates global economic shifts, fostering resilience and prosperity in a dynamic European context. See Belgium GDP per capita.
Belgium GDP Statistics by Year
| Year | GDP Size (in billions $) |
| 2025 (projected) | 685 |
| 2024 | 665 |
| 2023 | 645 |
| 2022 | 594 |
| 2021 | 599 |
| 2020 | 530 |
| 2019 | 537 |
| 2018 | 543 |
| 2017 | 501 |
| 2016 | 474 |
| 2015 | 461 |
| 2014 | 538 |
| 2013 | 524 |
| 2012 | 498 |
| 2011 | 527 |
| 2010 | 482 |