
Namibias PPP GDP was $30.2 billion in 2023. Mining (diamonds, uranium) and tourism drive growth, with GDP per capita (PPP) at $11,600. Inequality and unemployment pose challenges, though green hydrogen projects offer potential. Infrastructure investment is key for diversification.[](https://data.opendatasoft.com/explore/dataset/gdp-ppp-the-world-bank%40kapsarc/)
Namibia GDP PPP Statistics by Year
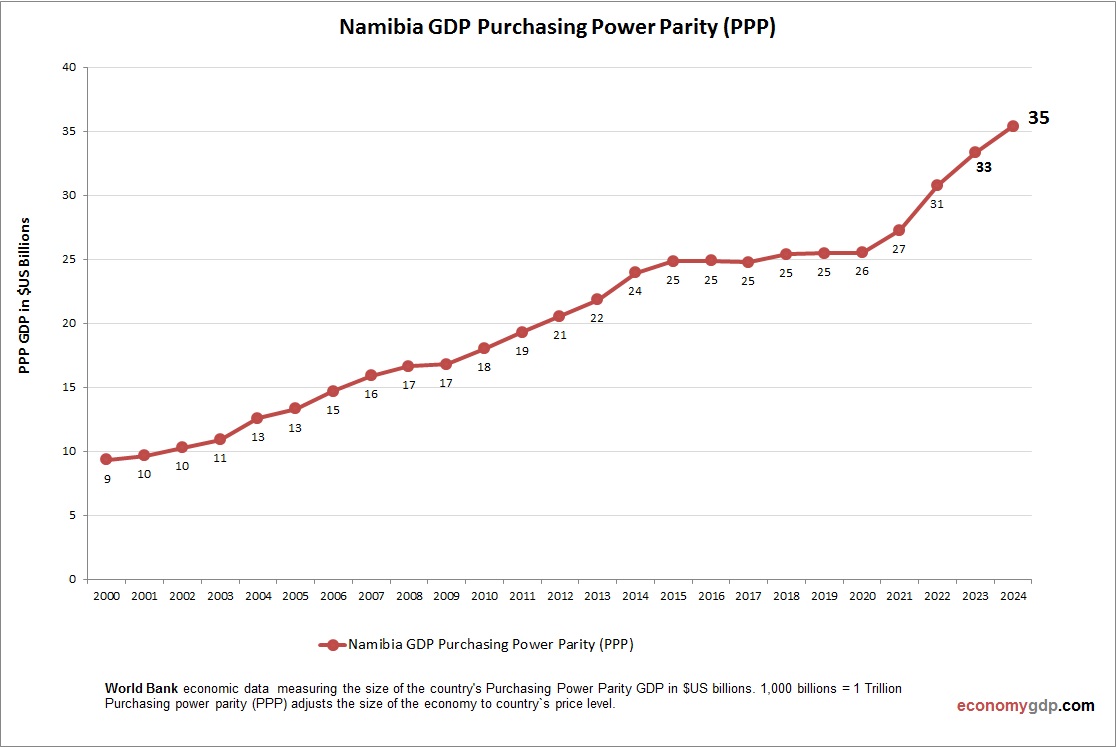
| Year | GDP, Purchasing Power Parity (PPP) |
| 2000 | 9.3 |
| 2001 | 9.6 |
| 2002 | 10.3 |
| 2003 | 10.9 |
| 2004 | 12.6 |
| 2005 | 13.3 |
| 2006 | 14.7 |
| 2007 | 15.9 |
| 2008 | 16.6 |
| 2009 | 16.8 |
| 2010 | 18.0 |
| 2011 | 19.3 |
| 2012 | 20.6 |
| 2013 | 21.8 |
| 2014 | 24.0 |
| 2015 | 24.8 |
| 2016 | 24.9 |
| 2017 | 24.8 |
| 2018 | 25.4 |
| 2019 | 25.5 |
| 2020 | 25.5 |
| 2021 | 27.3 |
| 2022 | 30.8 |
| 2023 | 33.3 |
| 2024 | 35.4 |
| 2025 (Est.) | 37.5 |
| 2026 (Est.) | 40.0 |