
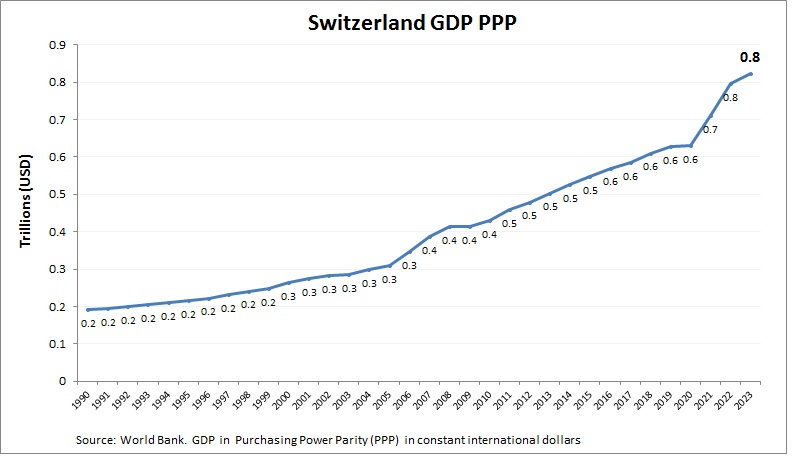
Switzerland economy graph showing purchasing power parity (PPP) growth from 1990 to today. Purchasing power parity adjusts the size of the economy to relevant price levels, i.e. measuring the price of specific goods in different countries and adjusting GDP accordingly.
Switzerland’s GDP per capita (PPP) in 2023 was around $81,684, representing approximately 460% of the global average, indicative of its strong economic performance. The Swiss economy specializes in finance, precision instruments, pharmaceuticals, and high-end manufacturing. See all Switzerland economy graphs.
Switzerland GDP PPP Statistics by Year
| Year | GDP, Purchasing Power Parity (PPP) |
| 2000 | 263.7 |
| 2001 | 273.4 |
| 2002 | 282.0 |
| 2003 | 284.3 |
| 2004 | 296.8 |
| 2005 | 308.8 |
| 2006 | 346.2 |
| 2007 | 384.6 |
| 2008 | 411.5 |
| 2009 | 410.4 |
| 2010 | 425.9 |
| 2011 | 454.9 |
| 2012 | 475.3 |
| 2013 | 498.8 |
| 2014 | 519.3 |
| 2015 | 540.6 |
| 2016 | 564.0 |
| 2017 | 576.4 |
| 2018 | 601.9 |
| 2019 | 632.3 |
| 2020 | 630.6 |
| 2021 | 705.1 |
| 2022 | 828.7 |
| 2023 | 845.7 |
| 2024 | 869.0 |
| 2025 (Est.) | 890.0 |
| 2026 (Est.) | 915.0 |