
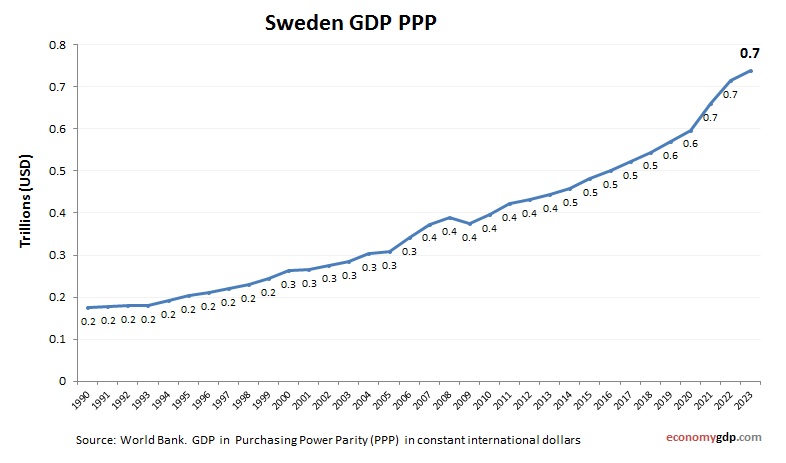
Sweden economy graph showing purchasing power parity (PPP) growth from 1990 to today. Purchasing power parity adjusts the size of the economy to relevant price levels, i.e. measuring the price of specific goods in different countries and adjusting GDP accordingly.
In 2023, Sweden’s GDP per capita (PPP) reached approximately $62,665, equating to about 353% of the global average. This reflects Sweden’s robust and high-income economy. Sweden’s production is centered on high-tech manufacturing, services, and exports like machinery, pharmaceuticals, and vehicles. See all Sweden economy graphs.
Sweden GDP PPP Statistics by Year
| Year | GDP, Purchasing Power Parity (PPP) |
| 2000 | 262.9 |
| 2001 | 266.4 |
| 2002 | 276.6 |
| 2003 | 284.8 |
| 2004 | 304.0 |
| 2005 | 308.8 |
| 2006 | 342.1 |
| 2007 | 373.4 |
| 2008 | 386.4 |
| 2009 | 372.8 |
| 2010 | 393.4 |
| 2011 | 418.9 |
| 2012 | 430.3 |
| 2013 | 442.6 |
| 2014 | 454.2 |
| 2015 | 477.9 |
| 2016 | 499.0 |
| 2017 | 517.7 |
| 2018 | 540.5 |
| 2019 | 586.4 |
| 2020 | 595.2 |
| 2021 | 653.4 |
| 2022 | 703.4 |
| 2023 | 729.4 |
| 2024 | 759.4 |
| 2025 (Est.) | 780.0 |
| 2026 (Est.) | 805.0 |