
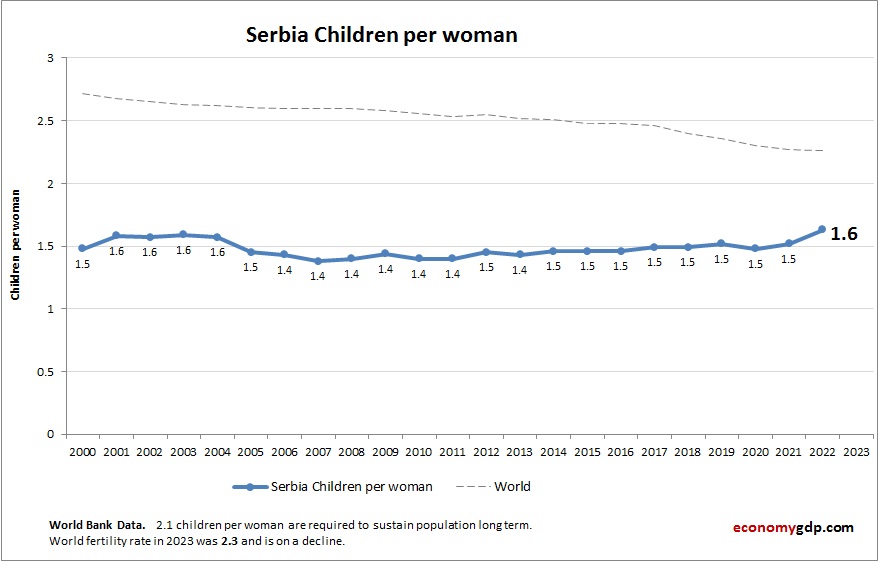
The above graph shows Serbia Children Per woman. The fertility rate statistics are compiled by World Bank. Based on the latest available information for Serbia.
Serbia has a low children per woman rate. Emigration, economic concerns, and aging demographics contribute to a shrinking population.
Serbia Children Per woman (Fertility Rate) Statistics by Year
| Year | Children per woman (fertility rate) |
| 2000 | 1.48 |
| 2001 | 1.58 |
| 2002 | 1.57 |
| 2003 | 1.59 |
| 2004 | 1.57 |
| 2005 | 1.45 |
| 2006 | 1.43 |
| 2007 | 1.38 |
| 2008 | 1.40 |
| 2009 | 1.44 |
| 2010 | 1.40 |
| 2011 | 1.40 |
| 2012 | 1.45 |
| 2013 | 1.43 |
| 2014 | 1.46 |
| 2015 | 1.46 |
| 2016 | 1.46 |
| 2017 | 1.49 |
| 2018 | 1.49 |
| 2019 | 1.52 |
| 2020 | 1.48 |
| 2021 | 1.52 |
| 2022 | 1.59 |
| 2023 | 1.62 |
| 2024 | 1.64 |
| 2025 (Est.) | 1.64 |
| 2026 (Est.) | 1.64 |