
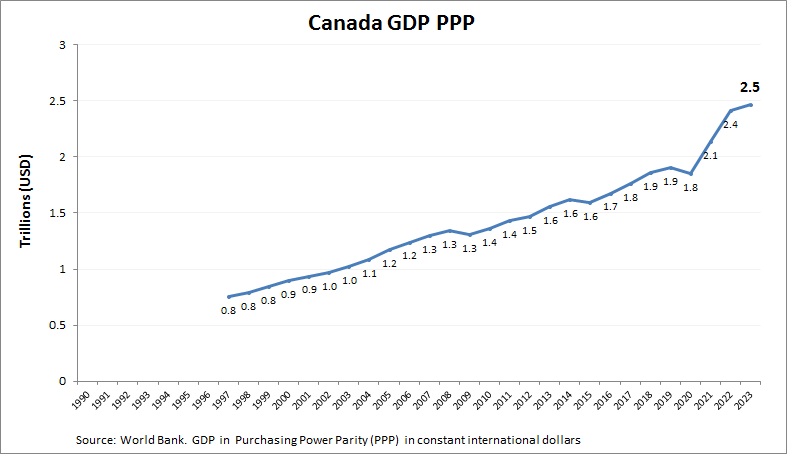
Canada economy graph showing purchasing power parity (PPP) growth from 2000 to today. Purchasing power parity adjusts the size of the economy to relevant price levels, i.e. measuring the price of specific goods in different countries and adjusting GDP accordingly.
Canadas GDP per capita (PPP) was approximately $65,000 in 2023. The economy is resource-rich with strong sectors in energy, manufacturing, and services. See all Canada economy graphs.
Canada GDP PPP Statistics by Year
| Year | GDP, Purchasing Power Parity (PPP) |
| 2000 | 900.6 |
| 2001 | 938.1 |
| 2002 | 971.0 |
| 2003 | 1,023.6 |
| 2004 | 1,083.7 |
| 2005 | 1,171.3 |
| 2006 | 1,241.7 |
| 2007 | 1,301.5 |
| 2008 | 1,342.4 |
| 2009 | 1,307.0 |
| 2010 | 1,363.7 |
| 2011 | 1,430.8 |
| 2012 | 1,468.1 |
| 2013 | 1,554.1 |
| 2014 | 1,621.4 |
| 2015 | 1,594.9 |
| 2016 | 1,678.1 |
| 2017 | 1,765.8 |
| 2018 | 1,853.0 |
| 2019 | 1,899.7 |
| 2020 | 1,847.8 |
| 2021 | 2,179.5 |
| 2022 | 2,489.7 |
| 2023 | 2,574.1 |
| 2024 | 2,667.7 |
| 2025 (Est.) | 2,740.0 |
| 2026 (Est.) | 2,820.0 |