
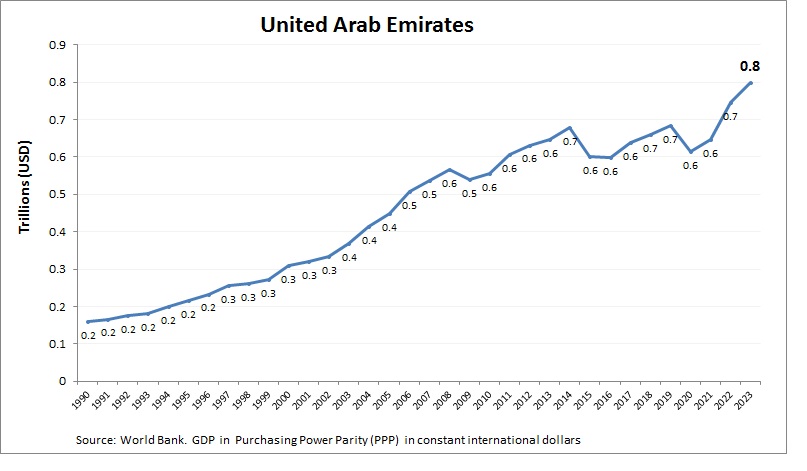
United Arab Emirates economy graph showing purchasing power parity (PPP) growth from 1990 to today. Purchasing power parity adjusts the size of the economy to relevant price levels, i.e. measuring the price of specific goods in different countries and adjusting GDP accordingly.
The UAE’s GDP per capita (PPP) is notably high, reflecting its oil wealth and diversified economy, positioning it among the upper echelons globally. It relies heavily on petroleum exports, with growing contributions from tourism, real estate, and finance.
United Arab Emirates GDP PPP Statistics by Year
| Year | GDP, Purchasing Power Parity (PPP) |
| 2000 | 324.6 |
| 2001 | 336.5 |
| 2002 | 350.0 |
| 2003 | 388.4 |
| 2004 | 437.0 |
| 2005 | 472.5 |
| 2006 | 535.0 |
| 2007 | 567.0 |
| 2008 | 596.4 |
| 2009 | 568.6 |
| 2010 | 584.8 |
| 2011 | 637.0 |
| 2012 | 659.3 |
| 2013 | 673.3 |
| 2014 | 705.0 |
| 2015 | 629.3 |
| 2016 | 625.3 |
| 2017 | 648.2 |
| 2018 | 723.9 |
| 2019 | 753.9 |
| 2020 | 627.9 |
| 2021 | 656.7 |
| 2022 | 756.3 |
| 2023 | 817.3 |
| 2024 | 870.4 |
| 2025 (Est.) | 925.0 |
| 2026 (Est.) | 980.0 |