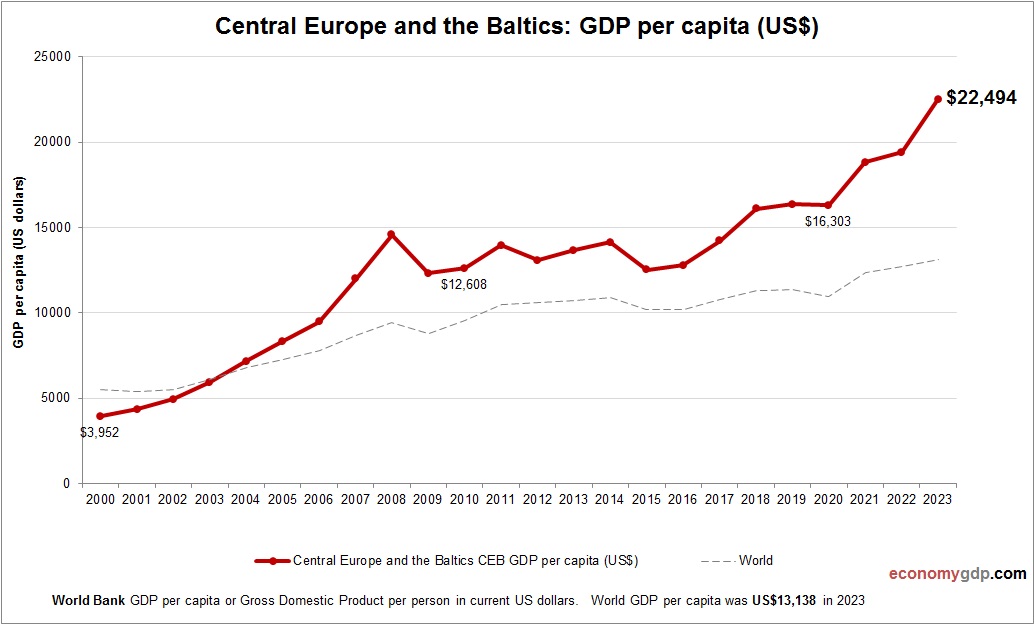
Central Europe and the Baltics Inflation
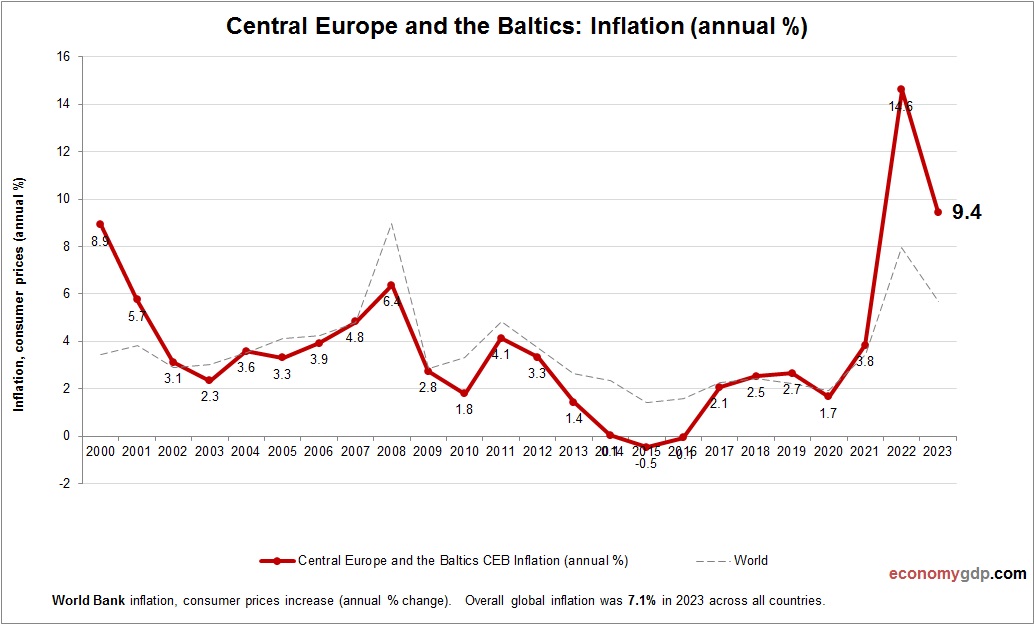
This chart demonstrates Central Europe and the Baltics Inflation. Inflation data is sourced from World Bank. Change in consumer prices for Central Europe and the Baltics. Inflation in Central Europe and the Baltics is driven by energy costs, wage growth, View diagram Central Europe and the Baltics Inflation