
Qatars PPP GDP reached $375.6 billion in 2023. Oil and gas dominate, with GDP per capita (PPP) at $129,000, among the highest globally. Wealth funds ensure stability, but hydrocarbon reliance poses risks. Diversification into finance and tourism is progressing, supported by infrastructure investments.
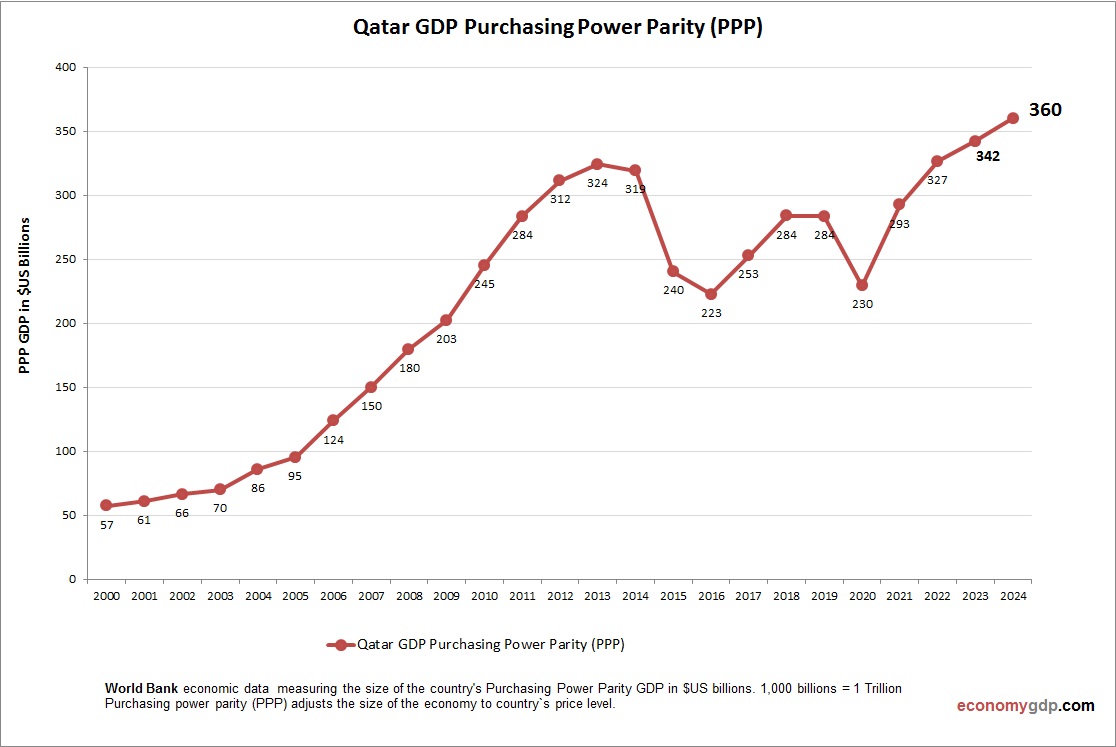
Qatar GDP PPP Statistics by Year
| Year | GDP, Purchasing Power Parity (PPP) |
| 2000 | 57.3 |
| 2001 | 60.9 |
| 2002 | 66.3 |
| 2003 | 70.1 |
| 2004 | 85.8 |
| 2005 | 95.1 |
| 2006 | 123.7 |
| 2007 | 149.9 |
| 2008 | 179.8 |
| 2009 | 202.6 |
| 2010 | 245.2 |
| 2011 | 283.7 |
| 2012 | 311.7 |
| 2013 | 324.3 |
| 2014 | 319.3 |
| 2015 | 240.4 |
| 2016 | 222.8 |
| 2017 | 252.9 |
| 2018 | 284.0 |
| 2019 | 283.7 |
| 2020 | 229.5 |
| 2021 | 292.7 |
| 2022 | 326.6 |
| 2023 | 343.6 |
| 2024 | 360.2 |
| 2025 (Est.) | 375.0 |
| 2026 (Est.) | 390.0 |