Erie Canal 1825: Boosting U.S. Trade and Economy
The Erie Canal, finished in 1825, connected the Great Lakes to the Atlantic, drastically cutting shipping costs, boosting trade, and turning New York City into America's economic powerhouse.

World economy charts, business frameworks and diagrams
The Erie Canal, finished in 1825, connected the Great Lakes to the Atlantic, drastically cutting shipping costs, boosting trade, and turning New York City into America's economic powerhouse.

Financial Flow Chart: A financial flow chart is a visual representation of the movement of money within a business or personal financial system. It tracks income, expenses, investments, and cash flow, illustrating how funds are allocated and managed. This chart View diagram Financial Flow Chart
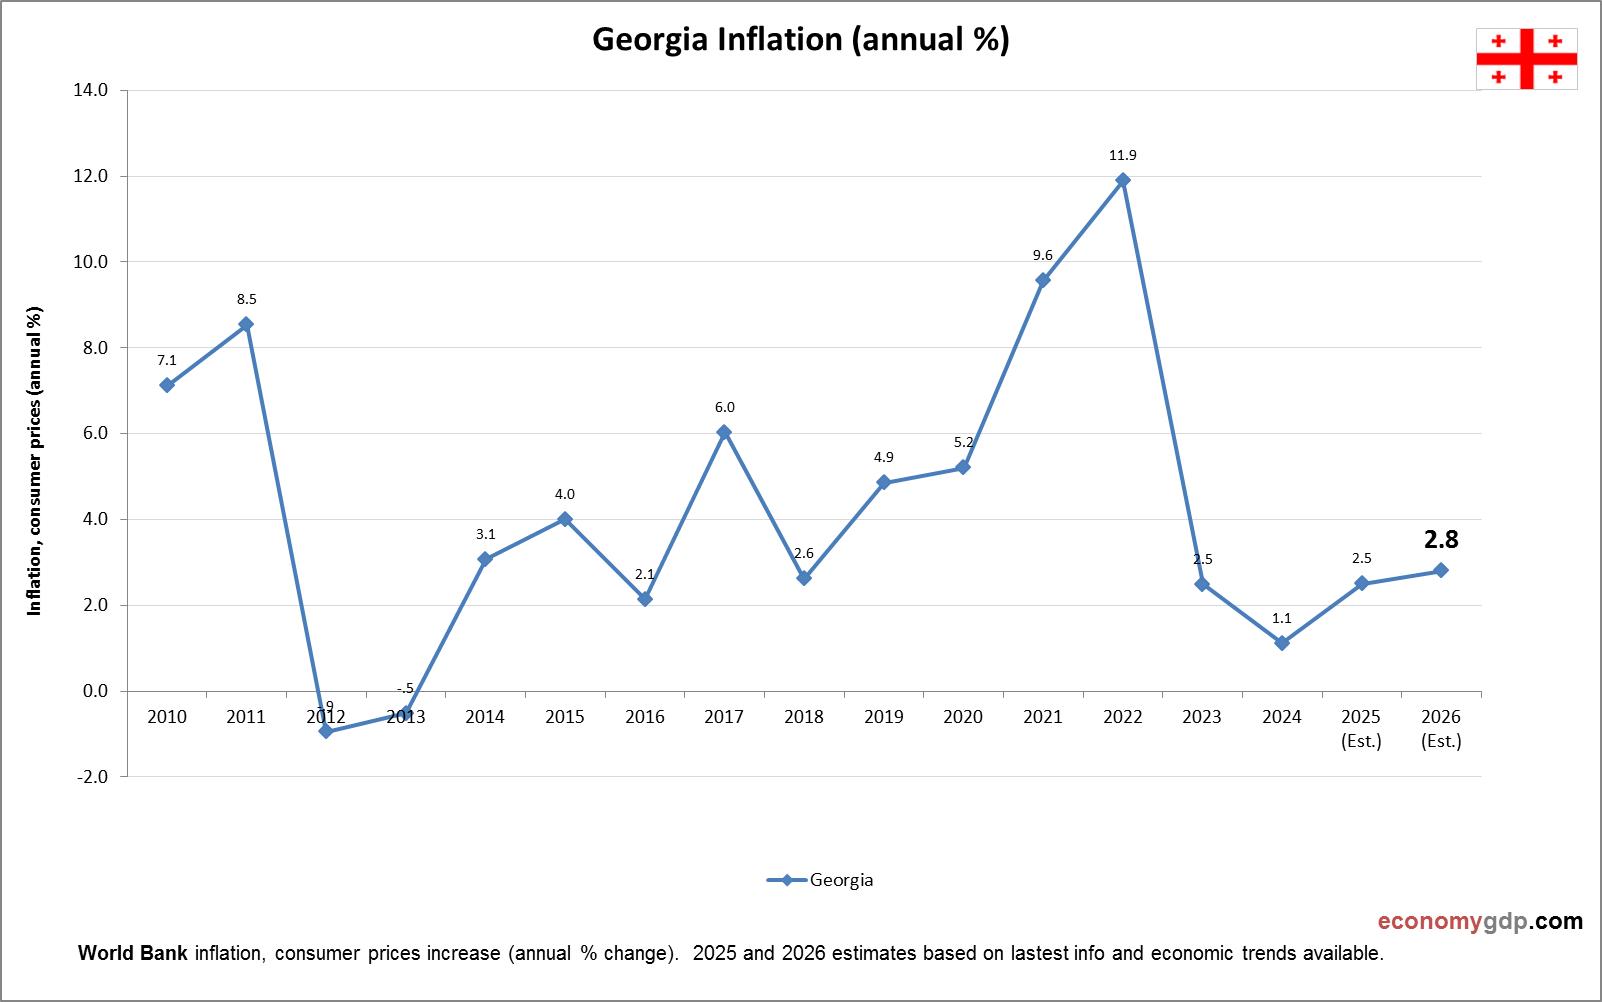
This chart demonstrates Georgia Inflation. Inflation data is sourced from World Bank. Based on the latest economic data provided for Georgia. Georgias inflation stems from currency volatility, regional geopolitical tensions, and import dependency for energy and food products.

This graph shows OECD members GDP per capita. The economic data is provided by World Bank. Latest GDP per person information for OECD members. The average GDP per capita among OECD member countries in 2024 is approximately $50,000. These high-income View diagram OECD members GDP per capita
Australia's 1850s gold rush brought fortune seekers worldwide, boosting urban growth, commerce, and turning Melbourne into one of the planet's richest cities almost overnight.

Steps in Agile Methodology Framework: The steps in the Agile methodology framework typically include planning, design, development, testing, review, and release. Agile emphasizes iterative development, where projects are broken down into smaller, manageable units known as sprints. This approach fosters View diagram Steps in Agile Methodology Framework

This diagram presents Colombia Children Per woman. The fertility rate statistics are compiled by World Bank. Based on the latest demographics info provided for Colombia. Colombia has seen a steady drop in children per woman, thanks to urbanization, improved education, View diagram Colombia Children Per woman
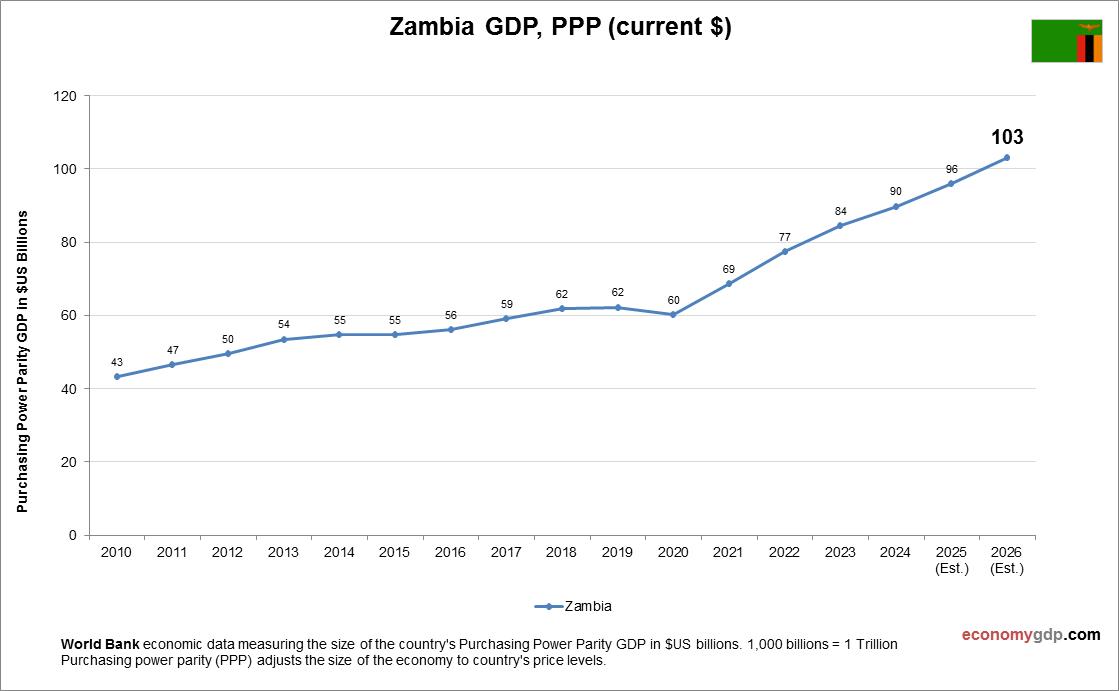
Zambias GDP (PPP) is estimated at $76.3 billion in 2025. Zambias economy relies on copper mining, agriculture, and tourism, with hydropower as a key sector. The PPP adjustment boosts GDP due to a low cost of living. Debt and commodity View diagram Zambia GDP Purchasing Power Parity
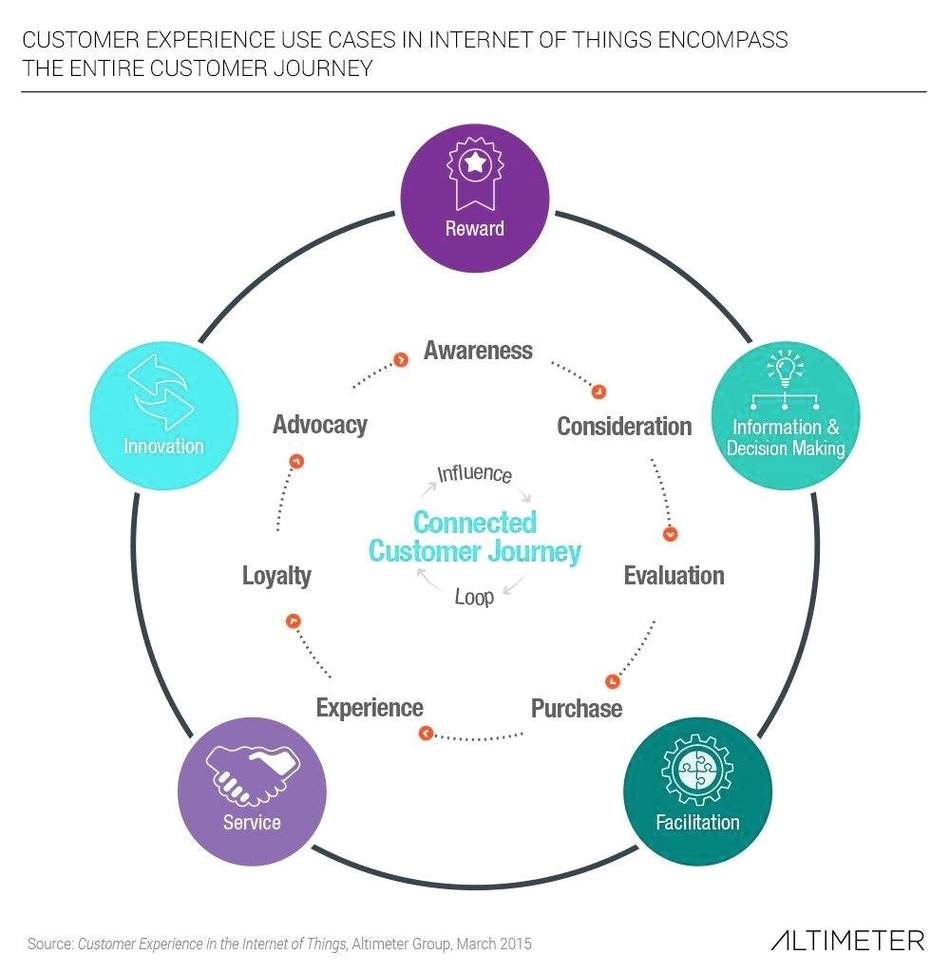
Customer Lifecycle Mapping Illustrated: Customer lifecycle mapping illustrated involves visually depicting the stages a customer goes through in their relationship with a business. These stages typically include awareness, consideration, purchase, retention, and advocacy. By mapping out these stages, businesses can View diagram Customer Lifecycle Mapping Illustrated

The above graph shows Bahrain Fertility Rate. This is according to World Bank birth stats by country. Based on the latest available information for Bahrain. Bahrain has a low fertility rate, influenced by urbanization, high living costs, and changing social View diagram Bahrain Fertility Rate