
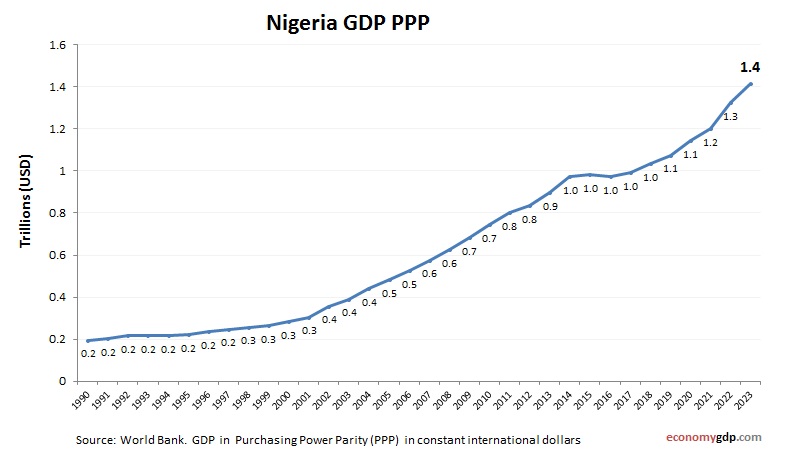
Nigeria economy graph showing purchasing power parity (PPP) growth from 2000 to today. Purchasing power parity adjusts the size of the economy to relevant price levels, i.e. measuring the price of specific goods in different countries and adjusting GDP accordingly.
Nigeria’s GDP per capita (PPP) in 2023 was about $5,593, reflecting its status as a lower-middle-income economy. The economy is heavily dependent on oil exports, with additional contributions from agriculture, telecommunications, and services. See all Nigeria economy graphs.
Nigeria GDP PPP Statistics by Year
| Year | GDP, Purchasing Power Parity (PPP) |
| 2000 | 396.7 |
| 2001 | 429.7 |
| 2002 | 503.2 |
| 2003 | 550.9 |
| 2004 | 618.0 |
| 2005 | 678.4 |
| 2006 | 741.7 |
| 2007 | 812.0 |
| 2008 | 883.6 |
| 2009 | 960.5 |
| 2010 | 1,050.0 |
| 2011 | 1,128.6 |
| 2012 | 1,175.4 |
| 2013 | 1,268.1 |
| 2014 | 1,374.9 |
| 2015 | 1,393.4 |
| 2016 | 1,382.3 |
| 2017 | 1,409.1 |
| 2018 | 1,467.0 |
| 2019 | 1,581.9 |
| 2020 | 1,586.7 |
| 2021 | 1,658.3 |
| 2022 | 1,853.3 |
| 2023 | 1,983.8 |
| 2024 | 2,114.3 |
| 2025 (Est.) | 2,250.0 |
| 2026 (Est.) | 2,400.0 |