
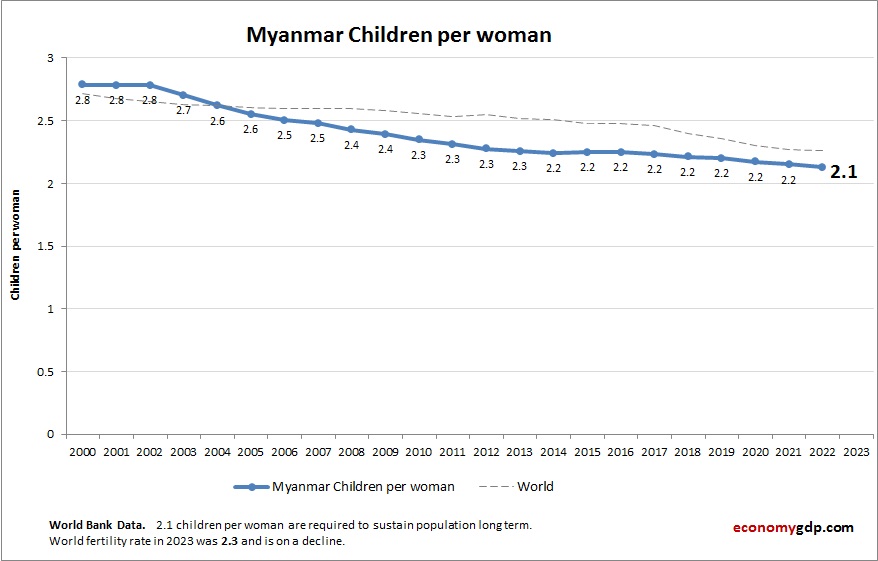
Chart above demonstrates Myanmar Children Per woman. This is according to World Bank birth stats by country. Based on the latest available information for Myanmar.
Myanmar has seen a steady decline in children per woman. Increased female education and gradual improvements in healthcare access are key contributors.
Myanmar Children Per woman (Fertility Rate) Statistics by Year
| Year | Children per woman (fertility rate) |
| 2000 | 2.81 |
| 2001 | 2.79 |
| 2002 | 2.77 |
| 2003 | 2.68 |
| 2004 | 2.59 |
| 2005 | 2.52 |
| 2006 | 2.47 |
| 2007 | 2.45 |
| 2008 | 2.40 |
| 2009 | 2.37 |
| 2010 | 2.34 |
| 2011 | 2.31 |
| 2012 | 2.28 |
| 2013 | 2.26 |
| 2014 | 2.25 |
| 2015 | 2.27 |
| 2016 | 2.27 |
| 2017 | 2.25 |
| 2018 | 2.23 |
| 2019 | 2.21 |
| 2020 | 2.18 |
| 2021 | 2.16 |
| 2022 | 2.13 |
| 2023 | 2.12 |
| 2024 | 2.10 |
| 2025 (Est.) | 2.10 |
| 2026 (Est.) | 2.0 |