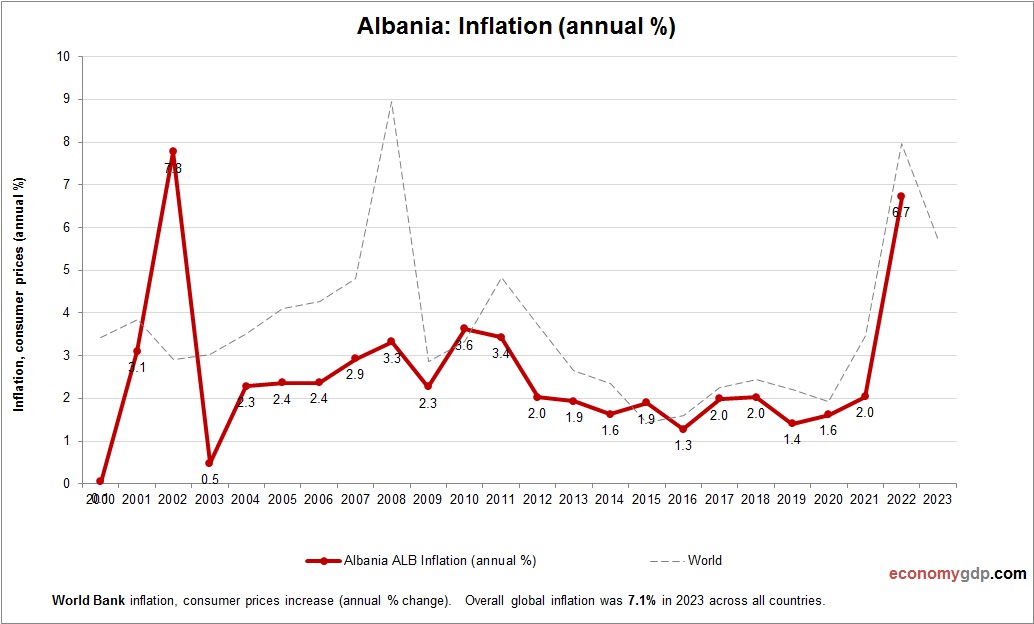
Latvia Inflation

Latvia Inflation

This chart demonstrates Latvia Inflation. Inflation data is sourced from World Bank. Based on the latest available information for Latvia. Latvia’s inflation is influenced by EU-wide energy prices, wage growth, and housing costs, with domestic demand adding to upward price View diagram Latvia Inflation

Malta GDP per capita

Malta GDP per capita

This graph shows Malta GDP per capita. The economic data is provided by World Bank. Based on the latest available information for Malta. Malta’s GDP per capita in 2024 is estimated at approximately $35,000. The economy is characterized by a View diagram Malta GDP per capita

Senegal Inflation

Senegal Inflation

This chart demonstrates Senegal Inflation. The consumer price statistics are compiled by World Bank. Change in consumer prices for Senegal. Senegal’s inflation is caused by food and fuel import dependency, regional trade challenges, and currency issues. External shocks, such as View diagram Senegal Inflation