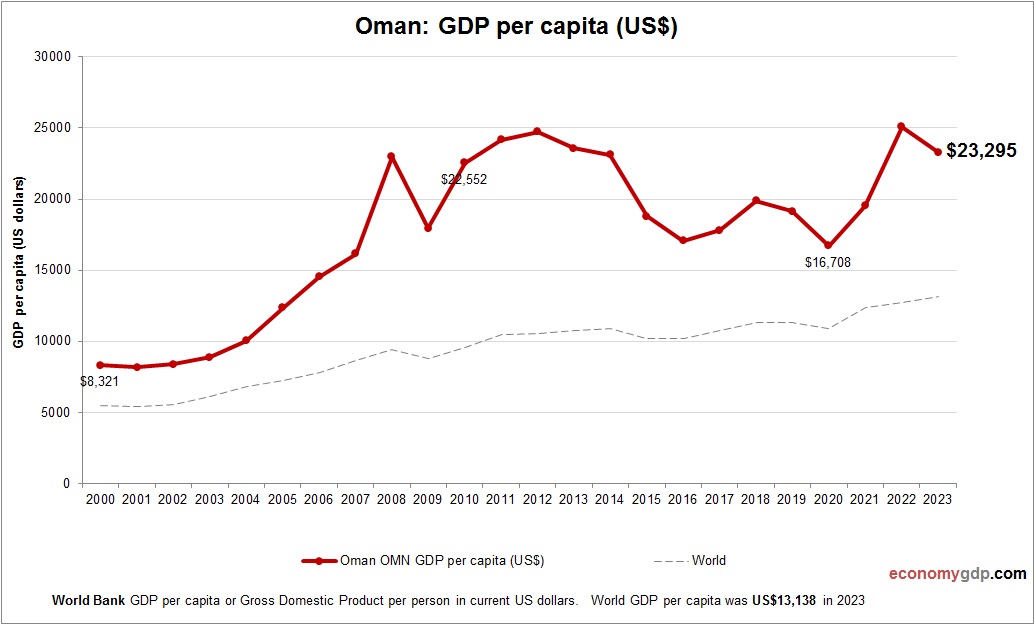
Category Archives: Economy
Sub-Saharan Africa (excluding high income) Inflation
This graph shows Sub-Saharan Africa (excluding high income) Inflation. Inflation data is sourced from World Bank. Change in consumer prices for Sub-Saharan Africa (excluding high income). Inflation in this group is mainly caused by currency depreciation, food insecurity, and fuel View diagram Sub-Saharan Africa (excluding high income) Inflation
Denmark Inflation
This chart demonstrates Denmark Inflation. This is according to World Bank consumer price index stats by country. Change in consumer prices for Denmark. Inflation in Denmark is influenced by energy prices, particularly natural gas and electricity, as well as global View diagram Denmark Inflation
West Bank and Gaza GDP per capita
This chart demonstrates West Bank and Gaza GDP per capita. The economic data is provided by World Bank. Based on the latest economic info provided for West Bank and Gaza. The GDP per capita in the West Bank and Gaza View diagram West Bank and Gaza GDP per capita
Madagascar Inflation
This graph shows Madagascar Inflation. The consumer price statistics are compiled by World Bank. Based on the latest economic data provided for Madagascar. Inflation in Madagascar is due to food insecurity, poor infrastructure, and reliance on imports, which make the View diagram Madagascar Inflation
Panama GDP per capita
This graph shows Panama GDP per capita. This is according to World Bank GDP stats by country. Based on the latest economic info provided for Panama. Panamas GDP per capita in 2024 is approximately $16,000. The economy is service-oriented, bolstered View diagram Panama GDP per capita
Australia GDP per capita
This diagram presents Australia GDP per capita. This is according to World Bank GDP stats by country. Latest GDP per person information for Australia. Australia’s GDP per capita is among the highest globally, reflecting its advanced economy characterized by a View diagram Australia GDP per capita
Thailand GDP per capita
This diagram presents Thailand GDP per capita. This is according to World Bank GDP stats by country. Based on the latest economic info provided for Thailand. Thailand’s GDP per capita in 2024 is estimated at approximately $8,000. The economy is View diagram Thailand GDP per capita
Rwanda GDP per capita
This chart demonstrates Rwanda GDP per capita. The gross domestic product statistics are compiled by World Bank. Based on the latest available information for Rwanda. Rwanda’s GDP per capita in 2024 is estimated at approximately $1,000. The economy is primarily View diagram Rwanda GDP per capita
Lebanon GDP per capita
This chart demonstrates Lebanon GDP per capita. The economic data is provided by World Bank. Latest GDP per person information for Lebanon. Lebanon’s GDP per capita in 2024 is estimated at approximately $4,487. The country’s economy has faced significant challenges View diagram Lebanon GDP per capita
