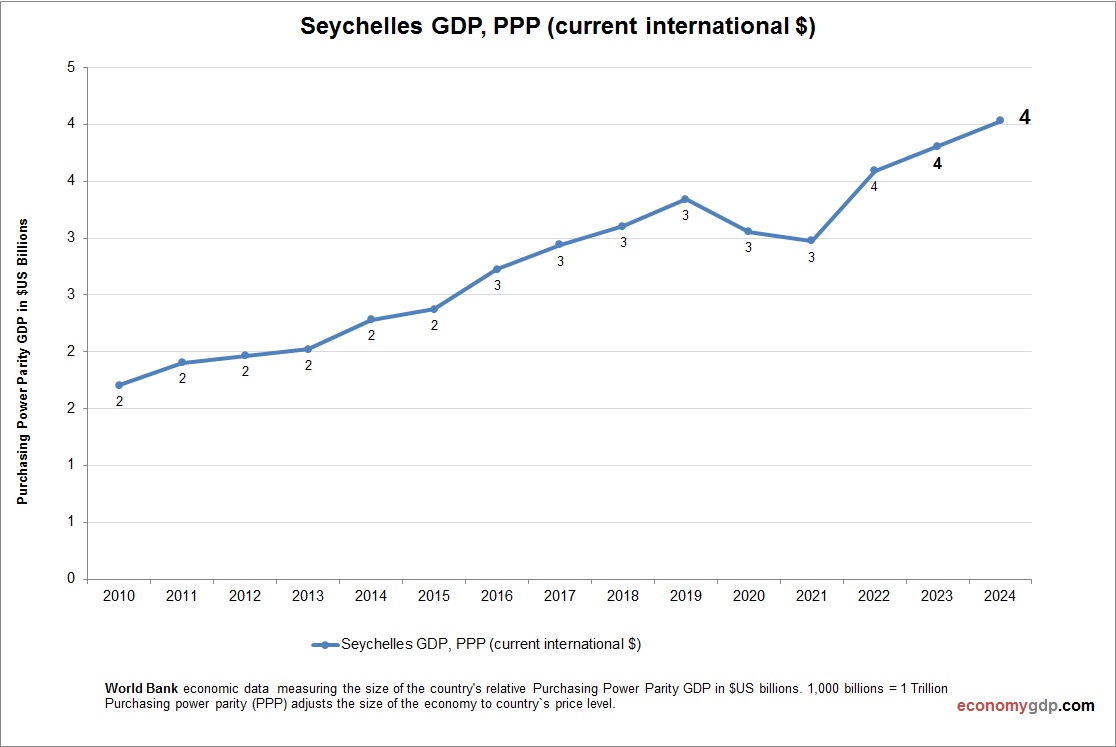
Seychelles GDP per capita
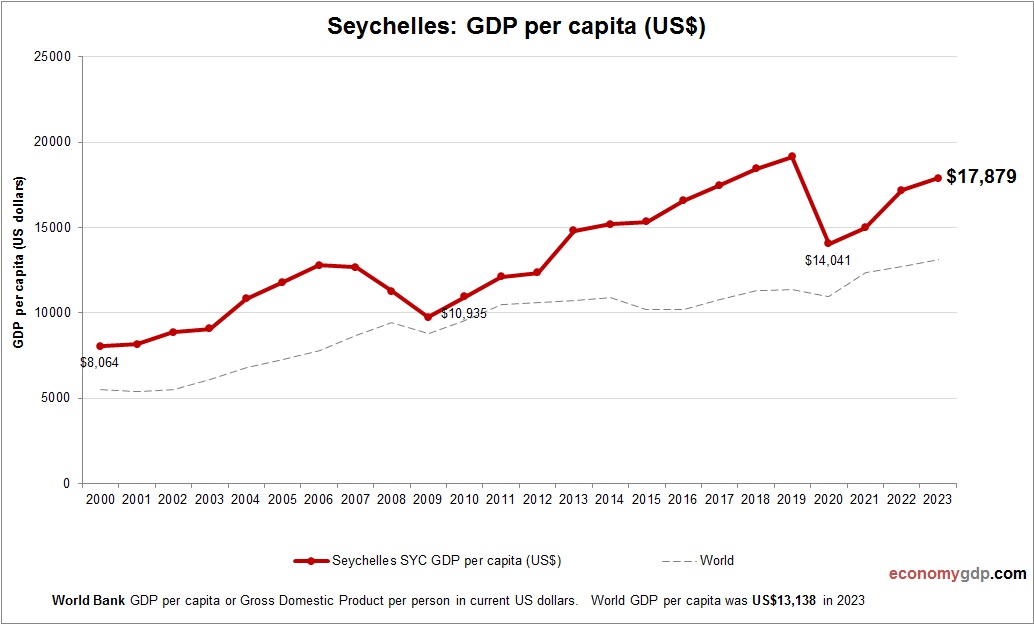
This graph shows Seychelles GDP per capita. This is according to World Bank GDP stats by country. Latest GDP per person information for Seychelles. Seychelles’ GDP per capita in 2024 is estimated at approximately $18,000. The economy is primarily based View diagram Seychelles GDP per capita