Somalia Economy

Somalia Economy

Somalia's economy is informal, with livestock exports like camels. Remittances sustain households. Fisheries offer potential. Mogadishu's trade revives. Challenges include piracy and clan conflicts. Efforts for stability attract aid. Agriculture focuses on bananas. Despite anarchy, resilient entrepreneurs drive recovery. World View diagram Somalia Economy→

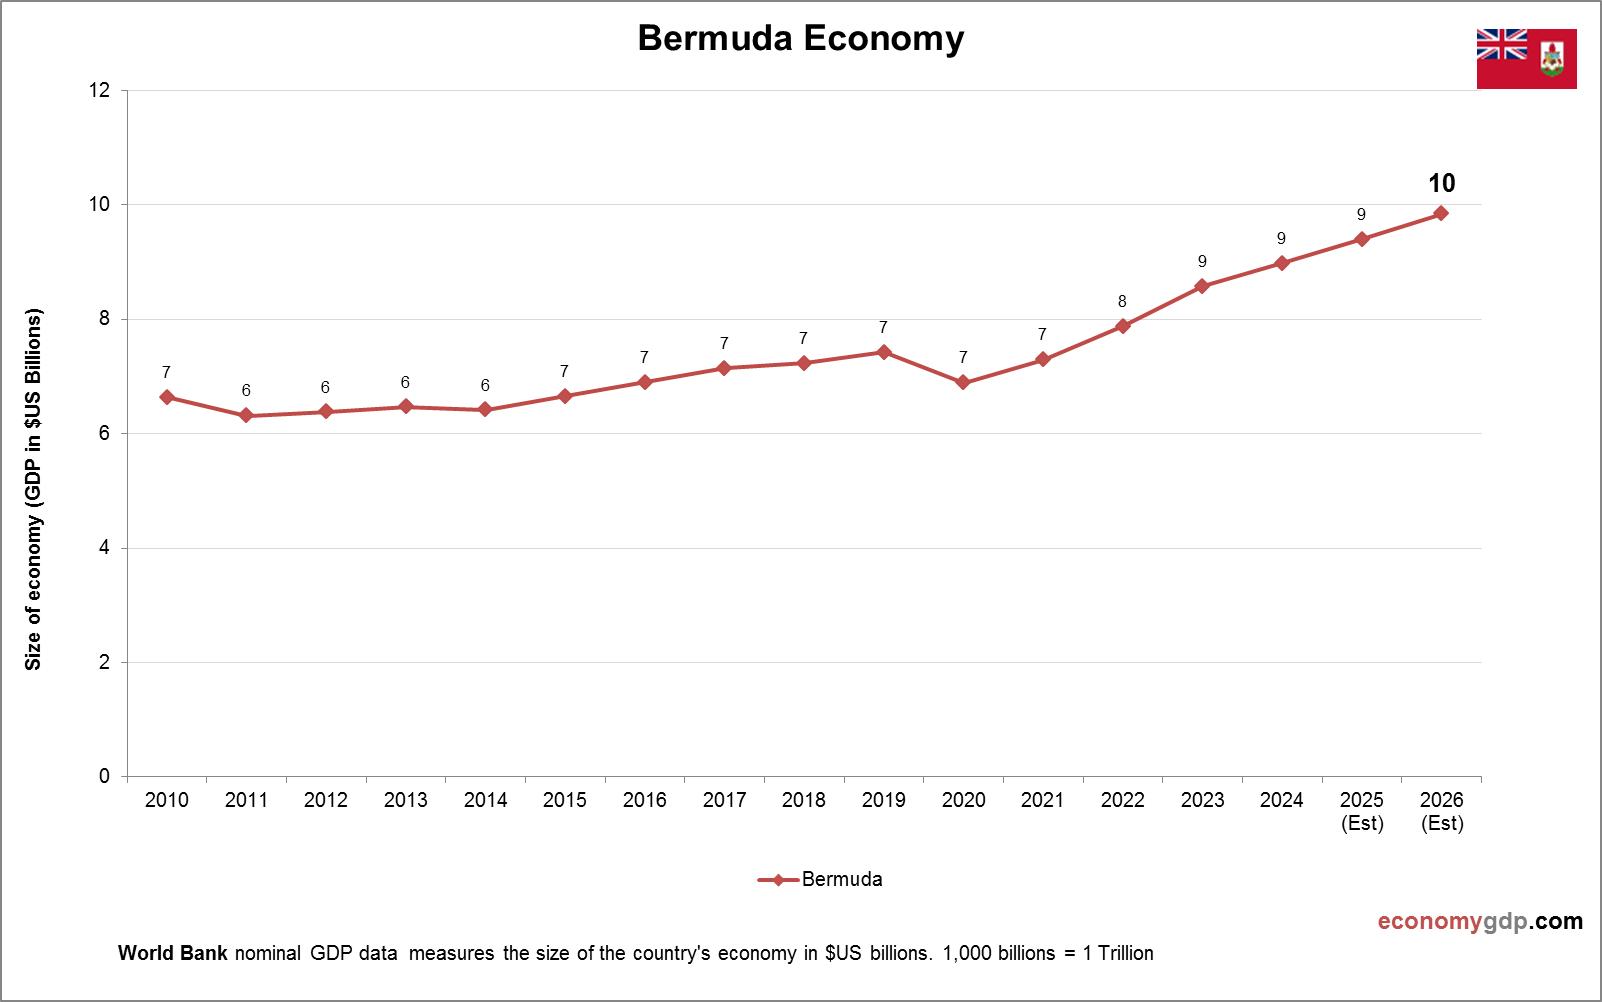
Bermuda Economy

Bermuda Economy

Bermuda's economy is insurance-led, tourism. Hamilton's finance. Challenges include storms. Efforts for fintech. Atlantic triangle wealth. World Bank Data. 2000-2024. Last updated Oct 2025. Refer to the latest year-over-year Bermuda GDP statistics.

Sudan GDP per capita

Sudan GDP per capita

This graph shows Sudan GDP per capita. The gross domestic product statistics are compiled by World Bank. Based on the latest economic info provided for Sudan. Sudan’s GDP per capita in 2024 is estimated at approximately $1,000. Despite being rich View diagram Sudan GDP per capita→

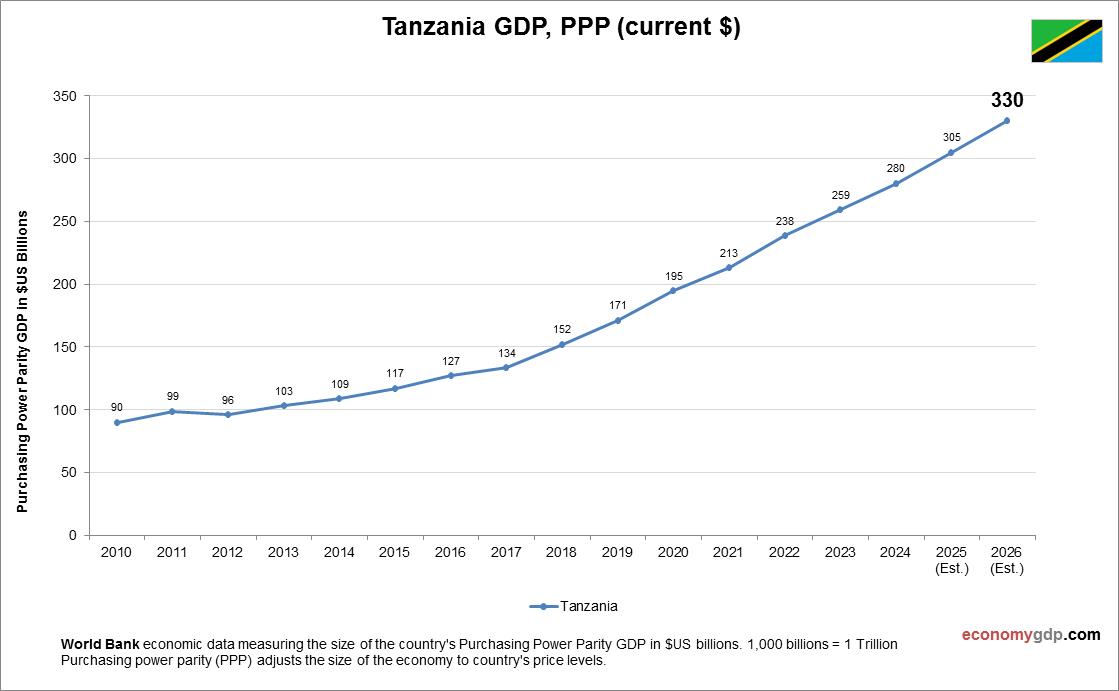
Tanzania Economy

Tanzania Economy

Tanzania's economy features agriculture, with cashews, coffee, and tobacco exports. Mining of gold and tanzanite grows. Tourism to Serengeti and Zanzibar thrives. Dar es Salaam's services expand. Hydropower and gas support energy. Challenges include poverty and infrastructure gaps. Efforts target View diagram Tanzania Economy→

Samoa GDP per capita

Samoa GDP per capita

This diagram presents Samoa GDP per capita. The economic data is provided by World Bank. Latest GDP per person information for Samoa. Samoa’s GDP per capita in 2024 is estimated at approximately $6,000. The economy is driven by agriculture, fishing, View diagram Samoa GDP per capita→