Curacao Inflation

Curacao Inflation

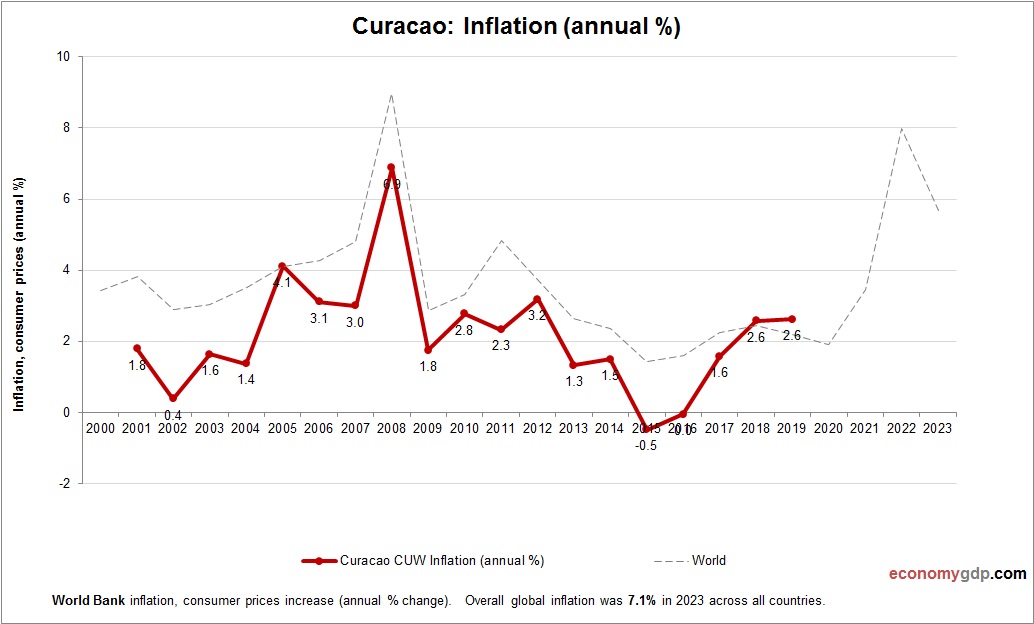
This chart demonstrates Curacao Inflation. The consumer price statistics are compiled by World Bank. Based on the latest economic data provided for Curacao. Inflation in Curaçao is largely driven by its dependence on imported goods, energy price changes, and a View diagram Curacao Inflation→

Ethiopia Inflation

Ethiopia Inflation

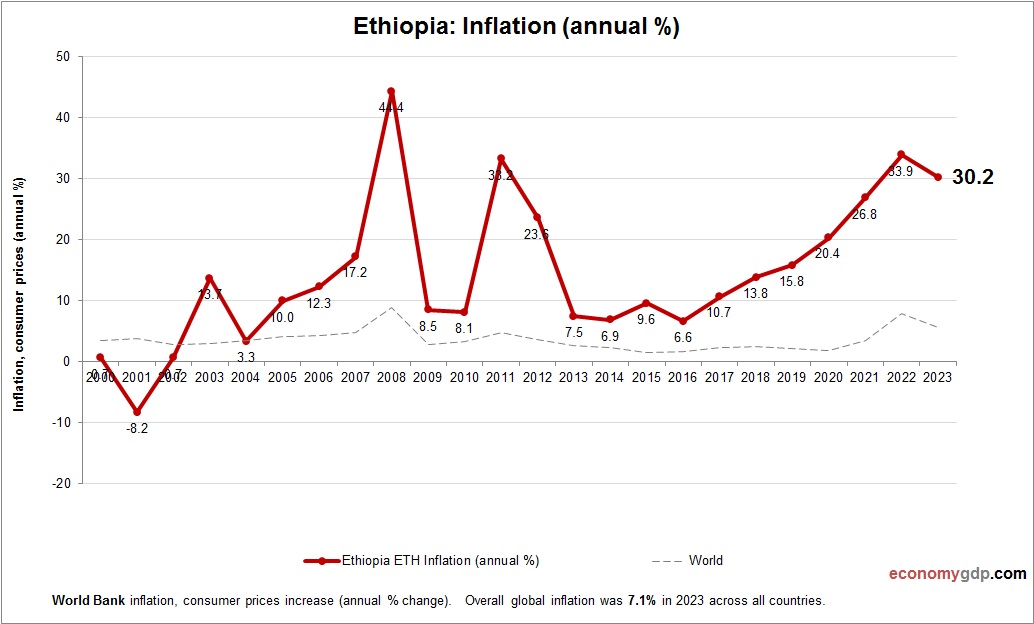
This graph shows Ethiopia Inflation. Inflation data is sourced from World Bank. Change in consumer prices for Ethiopia. Ethiopia suffers from high inflation due to conflict-related disruptions, food insecurity, and currency devaluation, particularly affecting staple goods.

British Virgin Islands GDP Purchasing Power Parity

British Virgin Islands GDP Purchasing Power Parity

British Virgin Islands’ GDP (PPP) is estimated at $1.6 billion in 2025, though data is limited. The economy relies heavily on offshore financial services and tourism, particularly yachting and luxury travel. The PPP adjustment moderates GDP due to a high View diagram British Virgin Islands GDP Purchasing Power Parity→

Morocco Inflation

Morocco Inflation

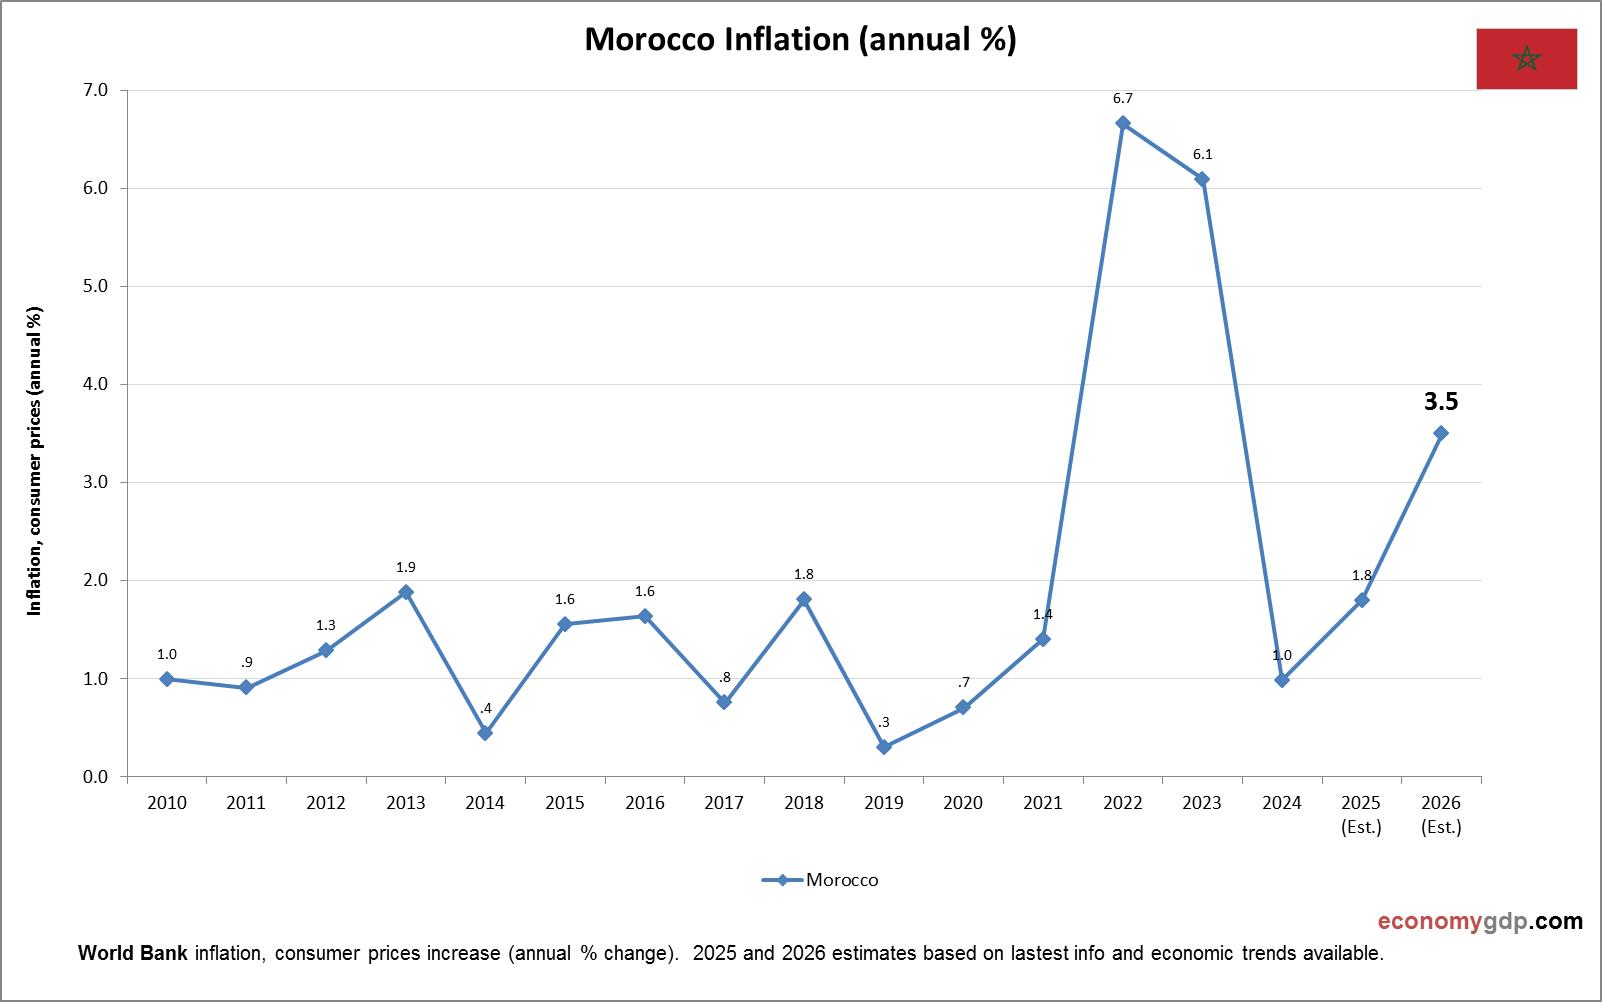
This graph shows Morocco Inflation. This is according to World Bank consumer price index stats by country. Based on the latest economic data provided for Morocco. Inflation in Morocco is driven by agricultural supply fluctuations due to drought, rising global View diagram Morocco Inflation→

Madagascar Economy

Madagascar Economy

Madagascar's economy features vanilla, cloves, and nickel exports. Agriculture employs most. Antananarivo's services grow. Challenges include cyclones. Efforts target textiles. Madagascar's biodiversity boosts eco-tourism. Growth hampered by instability. World Bank Data. 2000-2024. Last updated Oct 2025. Refer to the latest View diagram Madagascar Economy→