Process effectiveness assessment
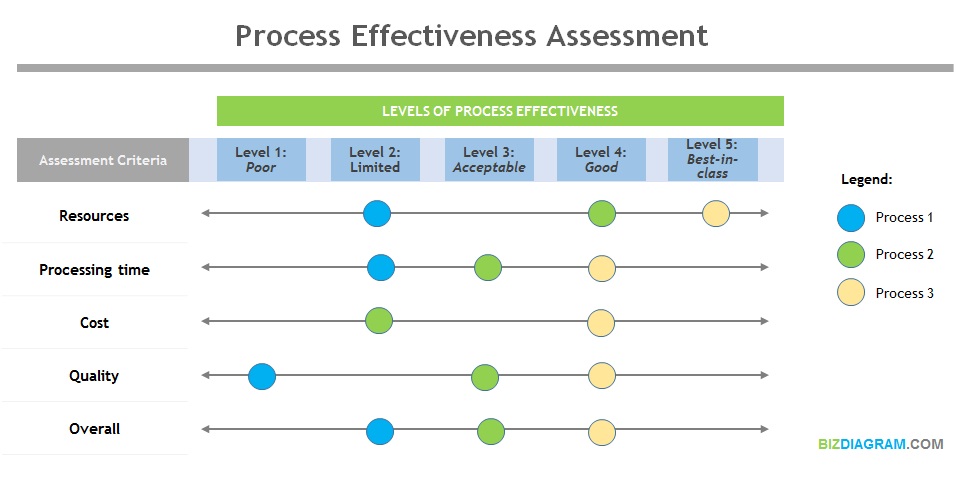
How to assess process effectiveness and compare various processes on the same diagram? The below framework can help complete process effectiveness assessments based on resources required, processing time, cost and quality as measured by the number of defects or other View diagram Process effectiveness assessment