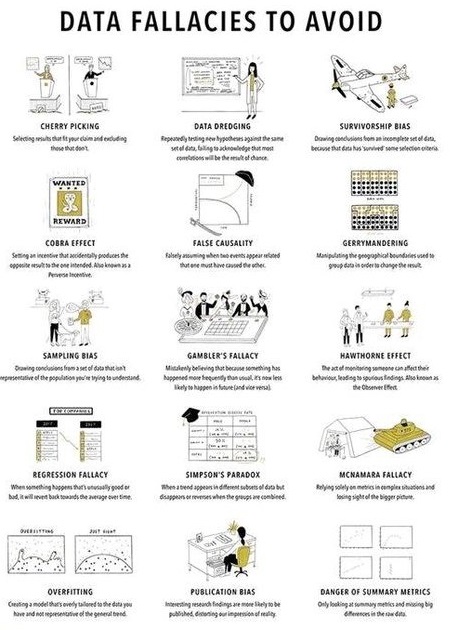
Data can be misleading and so can be visual representations of the data. For examples graphs, can often be created so that they mislead statistics.
Someone still needs to interpret data and the same piece of data can be interpreted in different ways. For example, if something takes a long time to complete, you may say that the current process in broken and needs fixing or you can say the process is working as intended but requires more resources. Same data point, may trigger different decisions and can be misleading. One decision, is changing the process, the other is investing more resources into it.
