Albania Fertility Rate
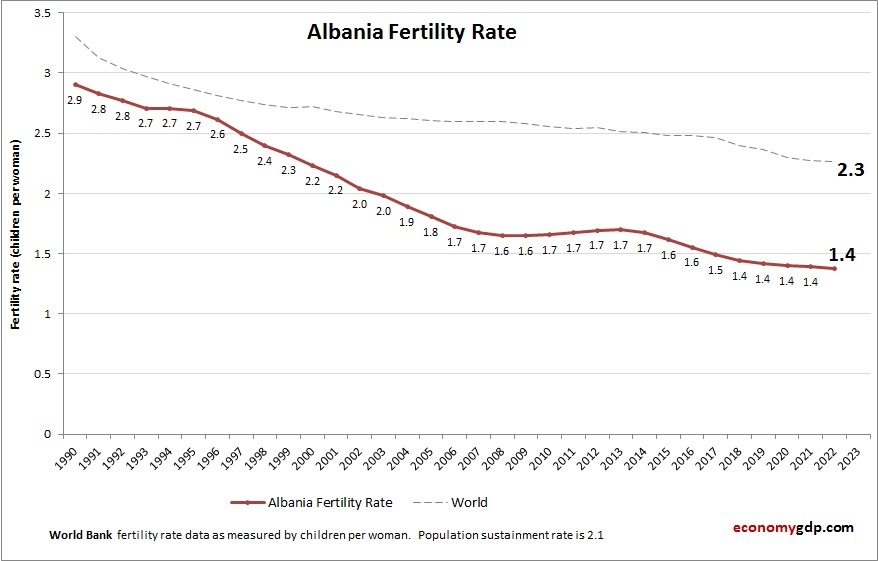
This diagram presents Albania Fertility Rate. World Bank is the source of this birth data. Based on the latest demographics info provided for Albania. Albanias fertility rate is low. Emigration and changing societal norms contribute to fewer children per woman View diagram Albania Fertility Rate