
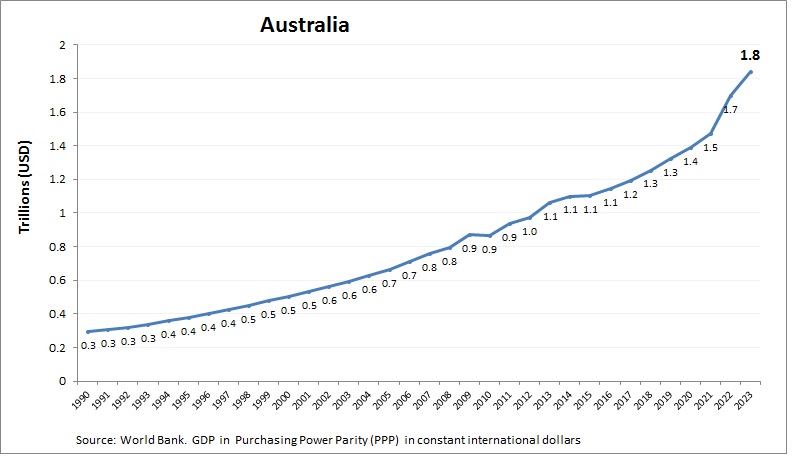
Australia economy graph showing purchasing power parity (PPP) growth from 2000 to today. Purchasing power parity adjusts the size of the economy to relevant price levels, i.e. measuring the price of specific goods in different countries and adjusting GDP accordingly.
Australia’s GDP per capita (PPP) in 2023 was around $62,000, reflecting its high-income economy. The nation’s economy is driven by services, mining (particularly iron ore and coal), agriculture, and a growing technology sector. See all Australia economy graphs.
Australia GDP PPP Statistics by Year
| Year | GDP, Purchasing Power Parity (PPP) |
| 2000 | 505.9 |
| 2001 | 533.7 |
| 2002 | 566.9 |
| 2003 | 594.9 |
| 2004 | 634.1 |
| 2005 | 667.6 |
| 2006 | 713.5 |
| 2007 | 764.5 |
| 2008 | 799.3 |
| 2009 | 877.1 |
| 2010 | 870.4 |
| 2011 | 941.7 |
| 2012 | 977.7 |
| 2013 | 1,066.7 |
| 2014 | 1,105.9 |
| 2015 | 1,106.6 |
| 2016 | 1,147.8 |
| 2017 | 1,194.3 |
| 2018 | 1,257.4 |
| 2019 | 1,339.9 |
| 2020 | 1,389.8 |
| 2021 | 1,498.2 |
| 2022 | 1,719.9 |
| 2023 | 1,926.8 |
| 2024 | 1,961.2 |
| 2025 (Est.) | 2,020.0 |
| 2026 (Est.) | 2,085.0 |