The Chile economy is driven by copper exports, which dominate global markets, alongside agriculture, fisheries, and services. Stable institutions and free-market policies attract foreign investment, particularly in mining and renewable energy. Tourism, including Patagonia and desert regions, is growing. However, inequality and reliance on copper prices pose risks. Investments in lithium and green energy aim to diversify, while social reforms address public demands for better education and healthcare, supporting long-term growth.
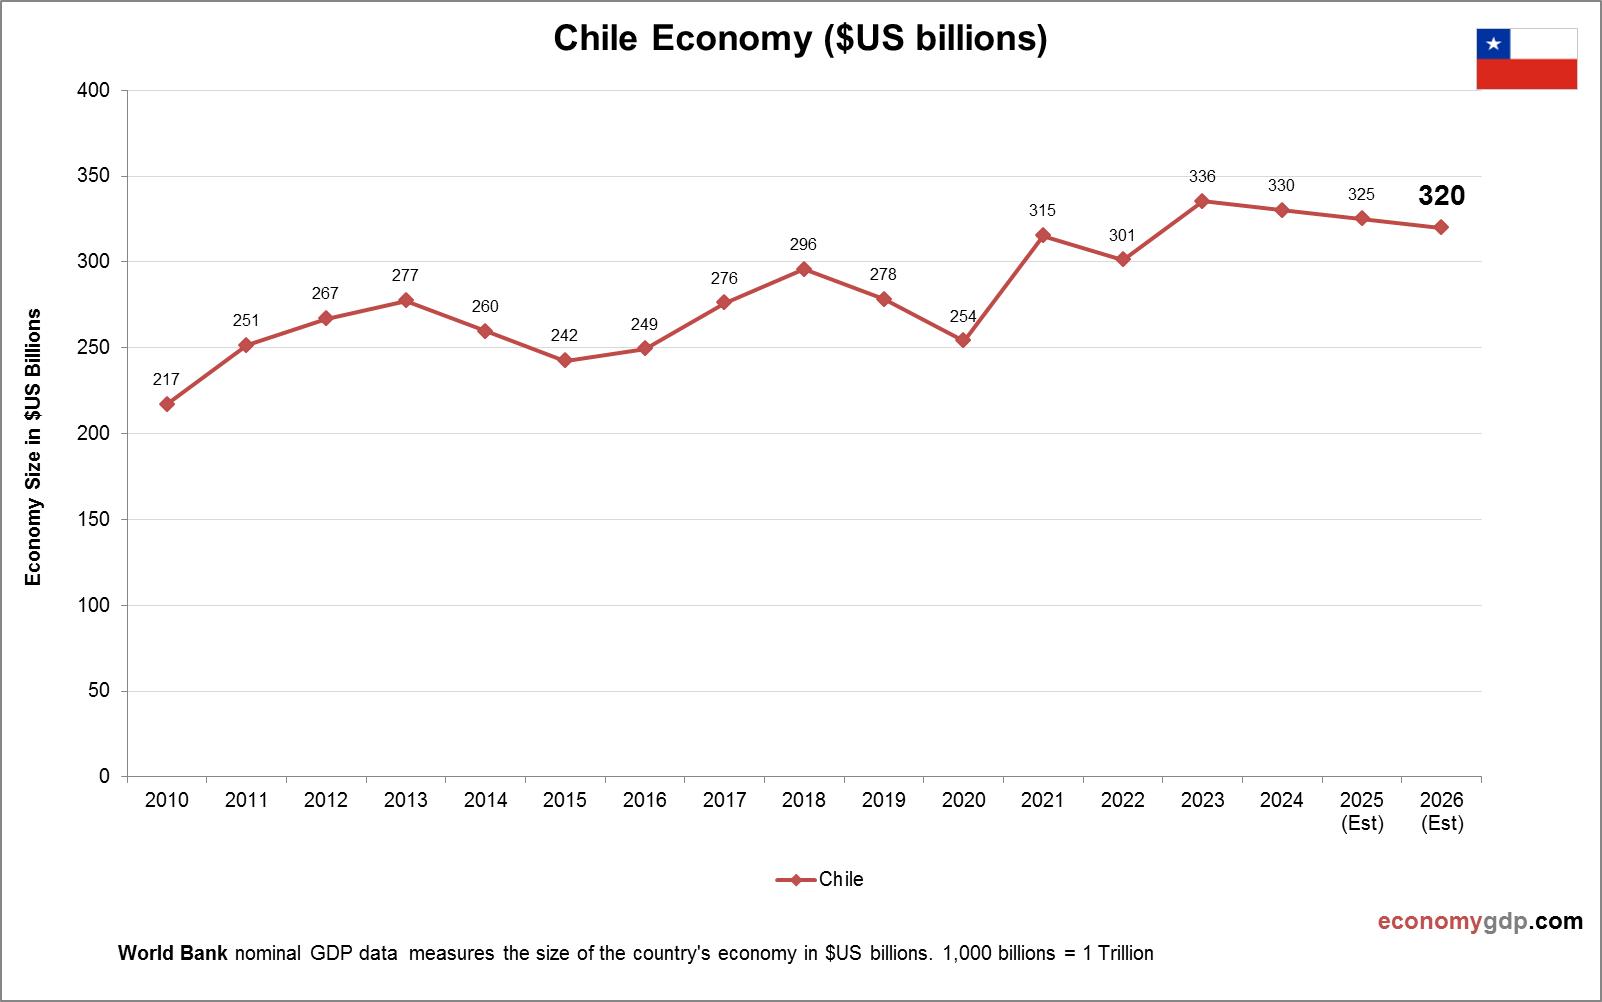
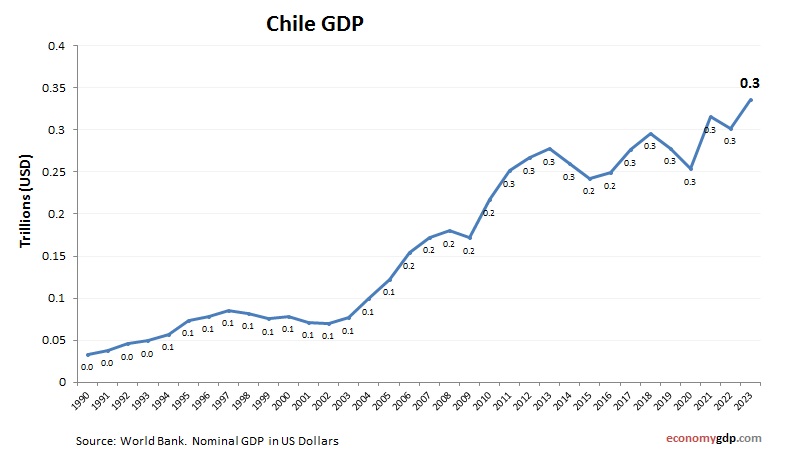
Chile Economy Size
Chile’s economy, at $300 billion, is one of South America’s largest. Mining, particularly copper, and services drive its GDP, supporting strong per capita income growth. See Chile GDP.
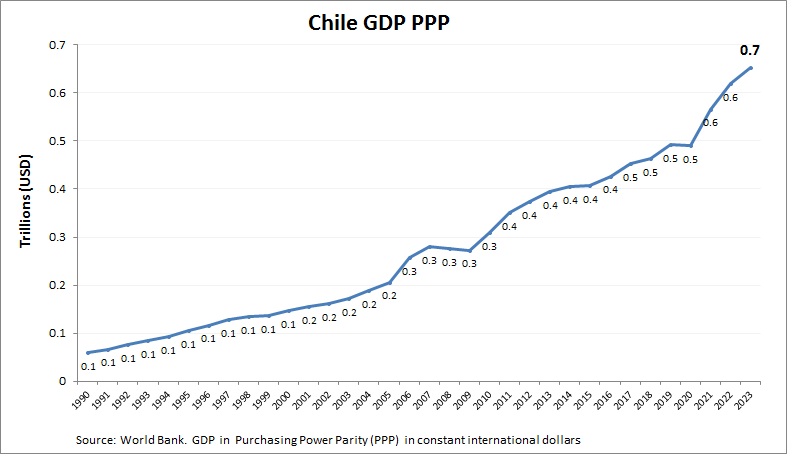
Chile Purchasing Power Parity (PPP)
Chile’s economy has a PPP GDP of $600 billion, double its $300 billion nominal GDP, reflecting lower costs for mining and services. PPP per capita is around $30,000, showing strong purchasing power. Copper and agriculture benefit from cost advantages, but export reliance poses risks. PPP highlights Chile’s robust domestic market potential.
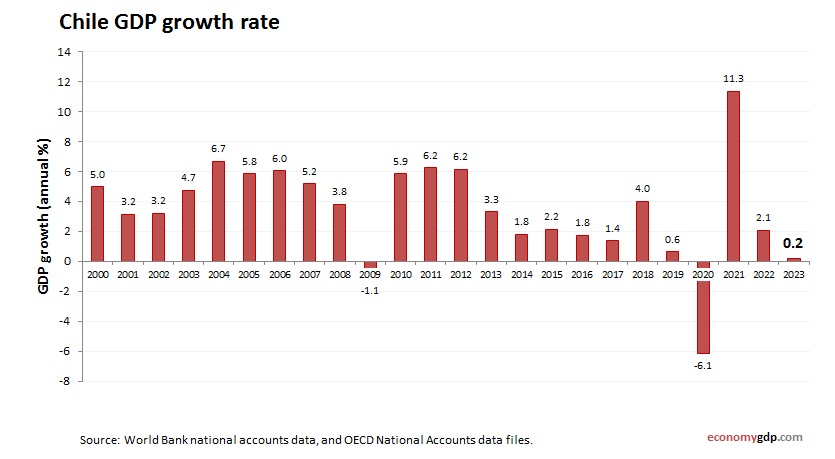
Chile Growth Rate
The economic growth rate is 3.0% in 2024, fueled by copper exports and services. Stable governance and trade agreements support growth, but commodity price volatility and inequality restrain expansion. Tourism and agriculture contribute modestly, while renewable energy investments enhance resilience, positioning the economy for steady progress despite global economic uncertainties.
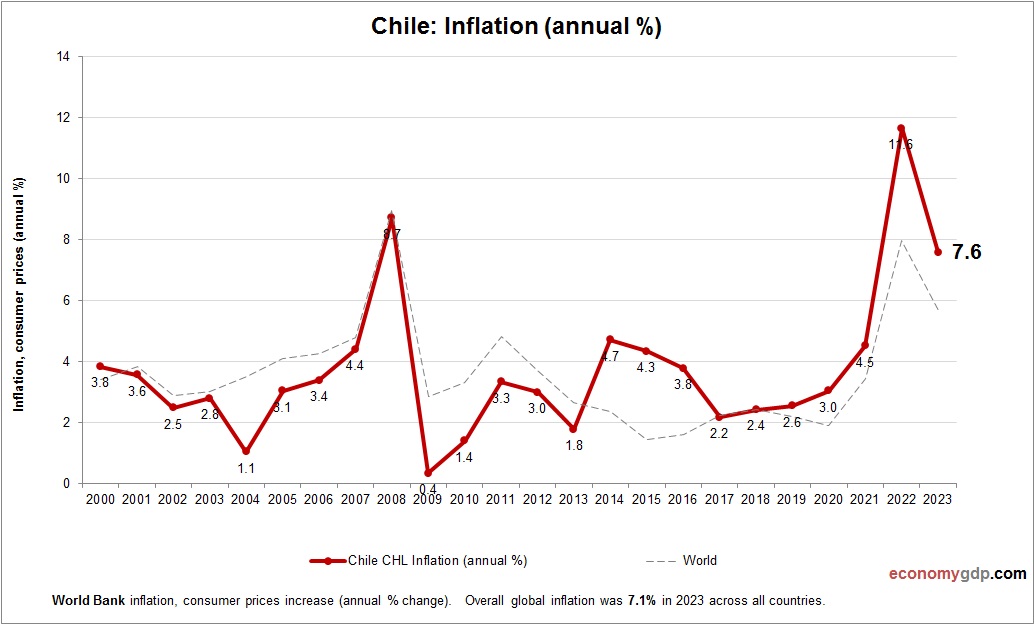
Chile Inflation
Chile’s inflation rate is around 4% in 2024, driven by rising global commodity prices and currency depreciation. Strong copper exports increase domestic demand, pushing service costs up. Drought affects agriculture, raising food prices. Central bank rate hikes and fiscal discipline help moderate inflation, though reliance on commodity exports poses risks.