
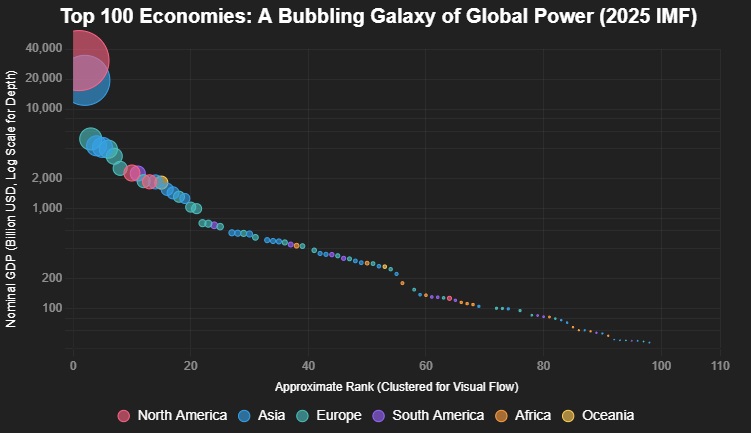
Here is another exciting list of the top 100 countries in 2025 with biggest economies listed by the size of the nominal GDP. Also, included in the table are purchasing power power GDP and projected real economy growth rate.
| Rank | Country | Nominal GDP (2025, US$ trillion) | GDP (PPP, 2025, US$ trillion) | 2025 Real GDP growth |
|---|---|---|---|---|
| 1 | United States | 30.62 | 30.62 | 2.0% |
| 2 | China | 19.40 | 41.02 | 4.8% |
| 3 | Germany | 5.01 | 6.15 | 0.2% |
| 4 | Japan | 4.28 | 6.76 | 1.1% |
| 5 | India | 4.13 | 17.71 | 6.6% |
| 6 | United Kingdom | 3.96 | 4.45 | 1.3% |
| 7 | France | 3.36 | 4.53 | 0.7% |
| 8 | Italy | 2.54 | 3.72 | 0.5% |
| 9 | Russia | 2.54 | 7.14 | 0.6% |
| 10 | Canada | 2.28 | 2.72 | 1.2% |
| 11 | Brazil | 2.26 | 4.97 | 2.4% |
| 12 | Spain | 1.89 | 2.83 | 2.9% |
| 13 | Mexico | 1.86 | 3.44 | 1.0% |
| 14 | South Korea | 1.86 | 3.36 | 0.9% |
| 15 | Australia | 1.83 | 1.98 | 1.8% |
| 16 | Turkey | 1.57 | 3.77 | 3.5% |
| 17 | Indonesia | 1.44 | 5.02 | 4.9% |
| 18 | Netherlands | 1.32 | 1.32 | 1.4% |
| 19 | Saudi Arabia | 1.27 | 2.69 | 4.0% |
| 20 | Poland | 1.04 | 2.02 | 3.2% |
| 21 | Switzerland | 1.03 | 0.83 | 1.2% |
| 22 | Taiwan | 0.98 | 1.68 | 2.9% |
| 23 | Sweden | 0.82 | 0.78 | 1.4% |
| 24 | Belgium | 0.72 | 0.75 | 1.3% |
| 25 | Thailand | 0.71 | 1.54 | 3.6% |
| 26 | Ireland | 0.69 | 0.68 | 2.3% |
| 27 | Israel | 0.61 | 0.52 | 3.0% |
| 28 | Norway | 0.61 | 0.55 | 1.8% |
| 29 | Nigeria | 0.60 | 1.36 | 3.0% |
| 30 | Austria | 0.59 | 0.64 | 1.4% |
| 31 | Egypt | 0.57 | 2.14 | 4.7% |
| 32 | Philippines | 0.54 | 1.36 | 5.8% |
| 33 | United Arab Emirates | 0.53 | 1.08 | 4.0% |
| 34 | Malaysia | 0.52 | 1.27 | 4.5% |
| 35 | Singapore | 0.51 | 0.62 | 2.3% |
| 36 | South Africa | 0.49 | 1.01 | 1.4% |
| 37 | Hong Kong | 0.48 | 0.52 | 2.8% |
| 38 | Denmark | 0.47 | 0.44 | 1.5% |
| 39 | Bangladesh | 0.46 | 1.21 | 6.4% |
| 40 | Vietnam | 0.45 | 1.52 | 6.0% |
| 41 | Colombia | 0.43 | 1.11 | 3.2% |
| 42 | Finland | 0.34 | 0.31 | 1.2% |
| 43 | Pakistan | 0.33 | 1.71 | 4.0% |
| 44 | Chile | 0.33 | 0.66 | 2.1% |
| 45 | Romania | 0.32 | 0.76 | 3.3% |
| 46 | Czech Republic | 0.32 | 0.45 | 2.2% |
| 47 | Portugal | 0.30 | 0.43 | 1.9% |
| 48 | Peru | 0.29 | 0.55 | 3.0% |
| 49 | New Zealand | 0.28 | 0.25 | 1.7% |
| 50 | Greece | 0.25 | 0.41 | 2.0% |
| 51 | Iraq | 0.25 | 0.43 | 3.5% |
| 52 | Qatar | 0.24 | 0.41 | 2.5% |
| 53 | Kazakhstan | 0.23 | 0.65 | 4.3% |
| 54 | Algeria | 0.22 | 0.60 | 1.9% |
| 55 | Hungary | 0.22 | 0.39 | 2.5% |
| 56 | Ukraine | 0.21 | 0.38 | 4.0% |
| 57 | Kuwait | 0.21 | 0.27 | 2.8% |
| 58 | Morocco | 0.20 | 0.36 | 3.5% |
| 59 | Ecuador | 0.20 | 0.24 | 1.0% |
| 60 | Angola | 0.19 | 0.97 | 2.8% |
| 61 | Sri Lanka | 0.19 | 0.35 | 3.8% |
| 62 | Dominican Republic | 0.18 | 0.37 | 4.5% |
| 63 | Cambodia | 0.18 | 0.85 | 5.5% |
| 64 | Sudan | 0.17 | 0.51 | 4.0% |
| 65 | Oman | 0.16 | 0.29 | 2.5% |
| 66 | Kenya | 0.16 | 0.45 | 5.0% |
| 67 | Hungary | 0.16 | 0.29 | 2.5% |
| 68 | Azerbaijan | 0.15 | 0.39 | 3.8% |
| 69 | Uganda | 0.15 | 0.53 | 5.5% |
| 70 | Bulgaria | 0.15 | 0.38 | 2.0% |
| 71 | Belarus | 0.14 | 0.40 | 2.5% |
| 72 | Tunisia | 0.14 | 0.32 | 3.0% |
| 73 | Serbia | 0.13 | 0.36 | 3.0% |
| 74 | Slovakia | 0.13 | 0.30 | 2.0% |
| 75 | Libya | 0.13 | 0.38 | 3.5% |
| 76 | Croatia | 0.12 | 0.28 | 2.0% |
| 77 | Slovenia | 0.11 | 0.25 | 2.0% |
| 78 | Guatemala | 0.11 | 0.36 | 3.5% |
| 79 | Costa Rica | 0.11 | 0.28 | 3.0% |
| 80 | Paraguay | 0.10 | 0.28 | 3.5% |
| 81 | Bolivia | 0.10 | 0.34 | 3.5% |
| 82 | El Salvador | 0.10 | 0.24 | 2.5% |
| 83 | Nicaragua | 0.09 | 0.23 | 3.0% |
| 84 | Trinidad and Tobago | 0.09 | 0.33 | 2.5% |
| 85 | Bahrain | 0.08 | 0.32 | 2.8% |
| 86 | Uzbekistan | 0.08 | 0.37 | 5.0% |
| 87 | Armenia | 0.08 | 0.27 | 3.5% |
| 88 | Lithuania | 0.08 | 0.27 | 2.5% |
| 89 | Slovakia | 0.07 | 0.22 | 2.0% |
| 90 | Jordan | 0.07 | 0.36 | 3.2% |
| 91 | Panama | 0.07 | 0.25 | 3.0% |
| 92 | Georgia | 0.07 | 0.22 | 3.5% |
| 93 | North Macedonia | 0.06 | 0.21 | 3.0% |
| 94 | Moldova | 0.06 | 0.21 | 3.5% |
| 95 | Kyrgyzstan | 0.06 | 0.22 | 4.0% |
| 96 | Namibia | 0.06 | 0.24 | 3.0% |
| 97 | Mauritius | 0.05 | 0.17 | 3.0% |
| 98 | Malawi | 0.05 | 0.21 | 4.5% |
| 99 | Eswatini | 0.05 | 0.12 | 2.5% |
| 100 | Lesotho | 0.05 | 0.10 | 2.0% |
Note: The 2025 economic data is based on the IMF’s October 2025 World Economic Outlook while 2025 real growth rate are projections based on EconomyGDP.com research.