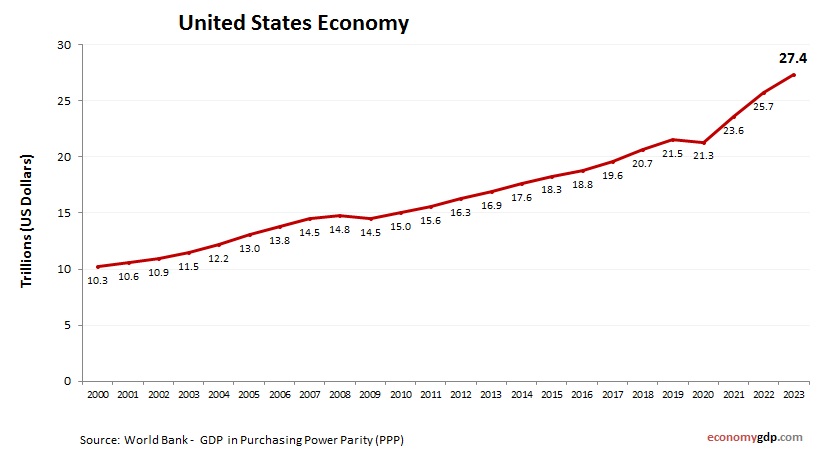
United States Economy in Graphs
The U.S. economy, one of the world’s largest, is driven by technology, finance, and healthcare. Silicon Valley leads in tech innovation, producing software, hardware, and AI solutions. Wall Street anchors global finance, while healthcare thrives with advanced medical research and View diagram United States Economy in Graphs