Skip to content
cropped-economygdp.jpg

Economy GDP

World economy charts, business frameworks and diagrams

Menu

Primary menu

  • Economy
    • Top Economies
  • Demographics
  • Business
    • Strategy
    • Project Management
    • Industry Examples
    • Leadership
    • HR
    • Industry Examples
  • Framework
  • Analysis
  • Lean Six Sigma
    • Lean
  • IT
    • Social Media
  • Marketing
  • Stories
  • Top

Tag Archives: United States economy

This tag provides a visual overview of the U.S. economy with GDP charts, inflation data, PPP comparisons, and indicators of national and sectoral growth.

Canada – US Tariffs Trade War Explained

Canada – US Tariffs Trade War Explained

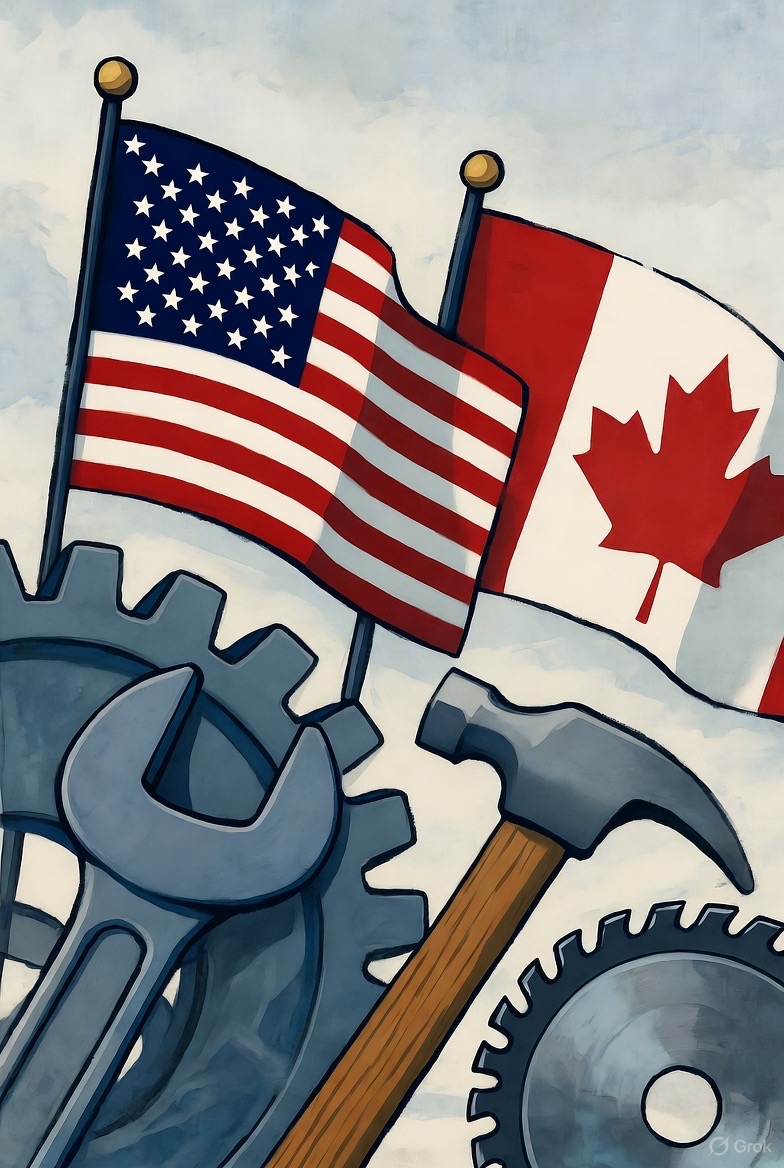
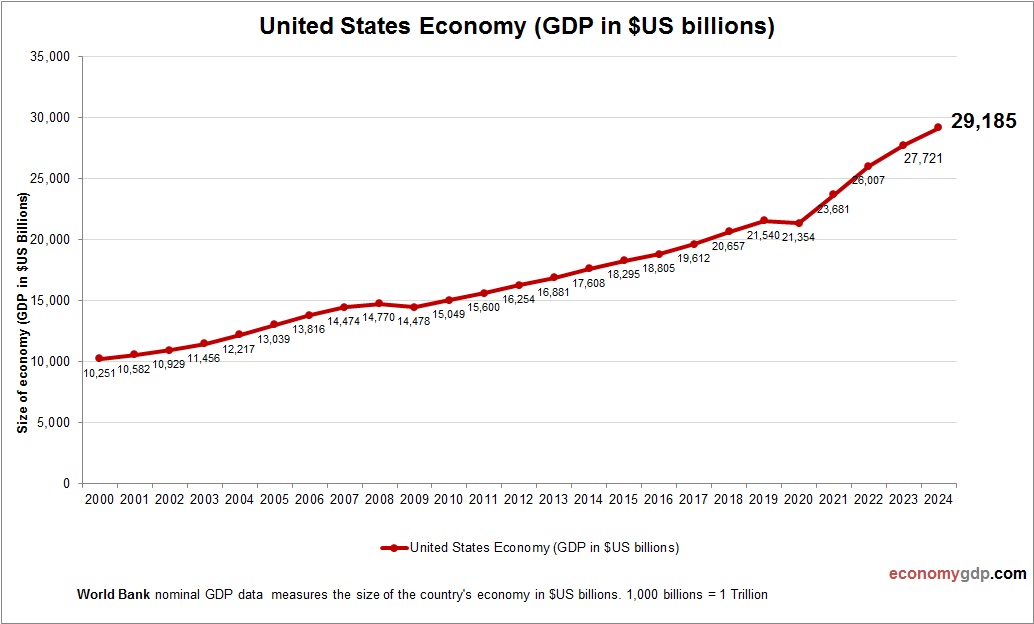
The long-standing economic partnership between the United States and Canada—built on mutual trade, shared supply chains, and geographic proximity—is now under significant strain. In 2025, Canada’s economy was still much dependent on US economy and remained one of the United View diagram Canada – US Tariffs Trade War Explained→

Posted in Economy, Stories | Tagged Canada economy, United States economy, USA economy

California Gold Rush Economic Transformation

California Gold Rush Economic Transformation

The California Gold Rush of 1848–1855 triggered one of the most dramatic economic transformations in U.S. history. What began as a local discovery at Sutter’s Mill rapidly drew hundreds of thousands of prospectors, entrepreneurs, and immigrants from around the world. View diagram California Gold Rush Economic Transformation→

Posted in Stories | Tagged United States economy, US Economy

United States Economy in Graphs

United States Economy in Graphs

The U.S. economy, one of the world’s largest, is driven by technology, finance, and healthcare. Silicon Valley leads in tech innovation, producing software, hardware, and AI solutions. Wall Street anchors global finance, while healthcare thrives with advanced medical research and View diagram United States Economy in Graphs→

Posted in Economy, Top Economies | Tagged United States economy, United States gdp

United States Inflation

United States Inflation

This graph shows United States Inflation. This is according to World Bank consumer price index stats by country. Change in consumer prices for United States. U.S. inflation has been fueled by pandemic recovery demand, supply chain bottlenecks, labor market tightness, View diagram United States Inflation→

Posted in Economy | Tagged United States economy

United States Economy

United States Economy

The United States has a vast and varied economic base, supported by strong consumer demand, world-leading technology companies, advanced manufacturing, finance, energy, and agriculture. Innovation hubs across the country drive breakthroughs in software, biotech, aerospace, and clean energy. A large View diagram United States Economy→

Posted in Economy | Tagged United States economy, United States gdp, USA economy, USA GDP

United States GDP

United States GDP

United States GDP from 2010 to today. World Bank and OECD data. GDP in US dollars. The United States is the world's largest economy, with GDP exceeding $27 trillion, powered by a vast and diverse mix of industries. Technology, finance, View diagram United States GDP→

Posted in Economy | Tagged United States economy, United States gdp, USA economy, USA GDP

United States GDP growth rate

United States GDP growth rate

United States economy annual growth rate from 2000 to today. GDP growth (yearly %). World Bank and OECD national accounts data. The U.S. economy expanded by 2.5% in 2023, driven by consumer spending, labor market strength, and technological innovation. While View diagram United States GDP growth rate→

Posted in Economy | Tagged United States economy, United States gdp

United States GDP Purchasing Power Parity

United States GDP Purchasing Power Parity

United States economy graph showing purchasing power parity (PPP) growth from 2000 to today. Purchasing power parity adjusts the size of the economy to relevant price levels, i.e. measuring the price of specific goods in different countries and adjusting GDP View diagram United States GDP Purchasing Power Parity→

Posted in Economy | Tagged United States economy, United States gdp

United States GDP PPP

United States GDP PPP

United States economy graph showing purchasing power parity (PPP) growth from 1990 to today. Purchasing power parity adjusts the size of the economy to relevant price levels, i.e. measuring the price of specific goods in different countries and adjusting GDP View diagram United States GDP PPP→

Posted in Economy | Tagged United States economy, United States gdp

Primary Sidebar Widget Area

Top Diagrams

Latest Posts

  • Paraguay GDP
  • Puerto Rico GDP per capita
  • Customer Segmentation Model
  • South Sudan GDP PPP
  • Paraguay GDP per capita
  • Tuvalu GDP per capita
  • Fraud Triangle
  • Togo GDP PPP
  • St. Kitts and Nevis GDP Purchasing Power Parity
  • AI Use Cases in Marketing Automation
  • Ukraine GDP
  • British East India Company 1600: Trade and Empire
  • Honduras Inflation
  • Macedonia GDP PPP
  • Top 100 World Economies
  • Twitter
Copyright © 2025 Economy GDP. All Rights Reserved.
Theme: Catch Box by Catch Themes
Scroll Up