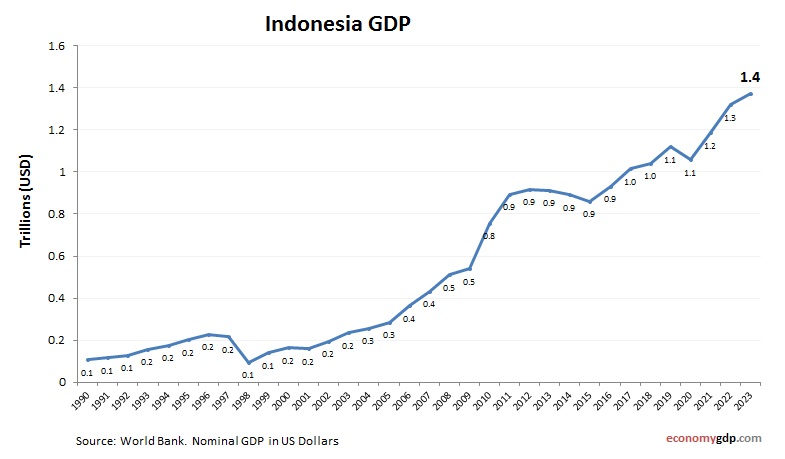
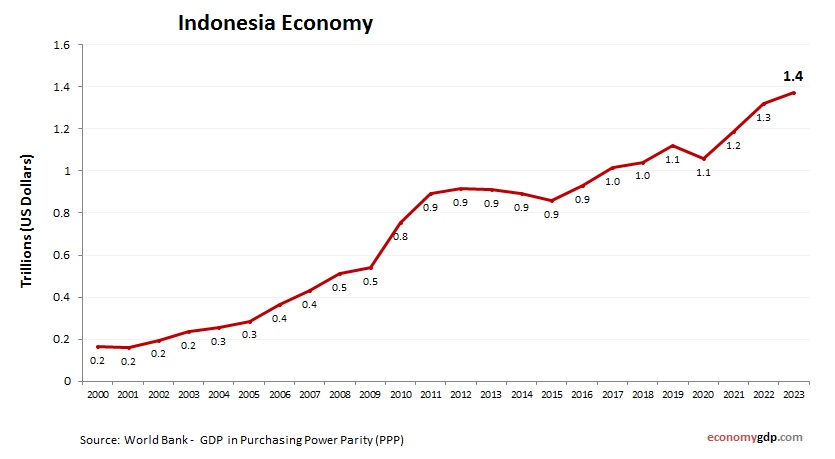
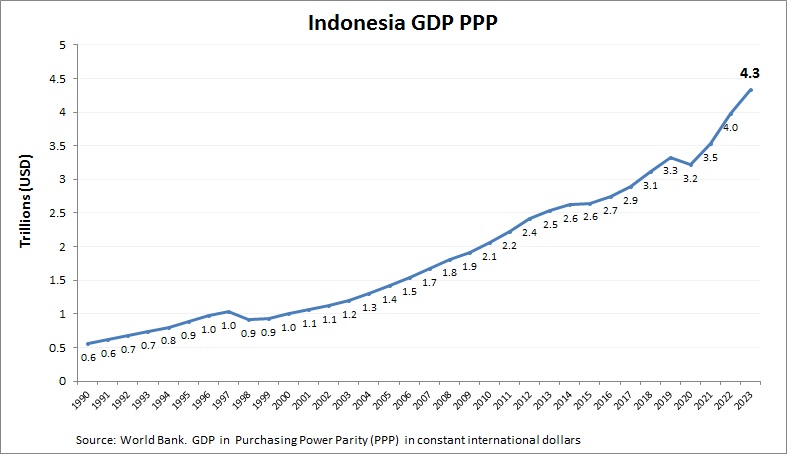
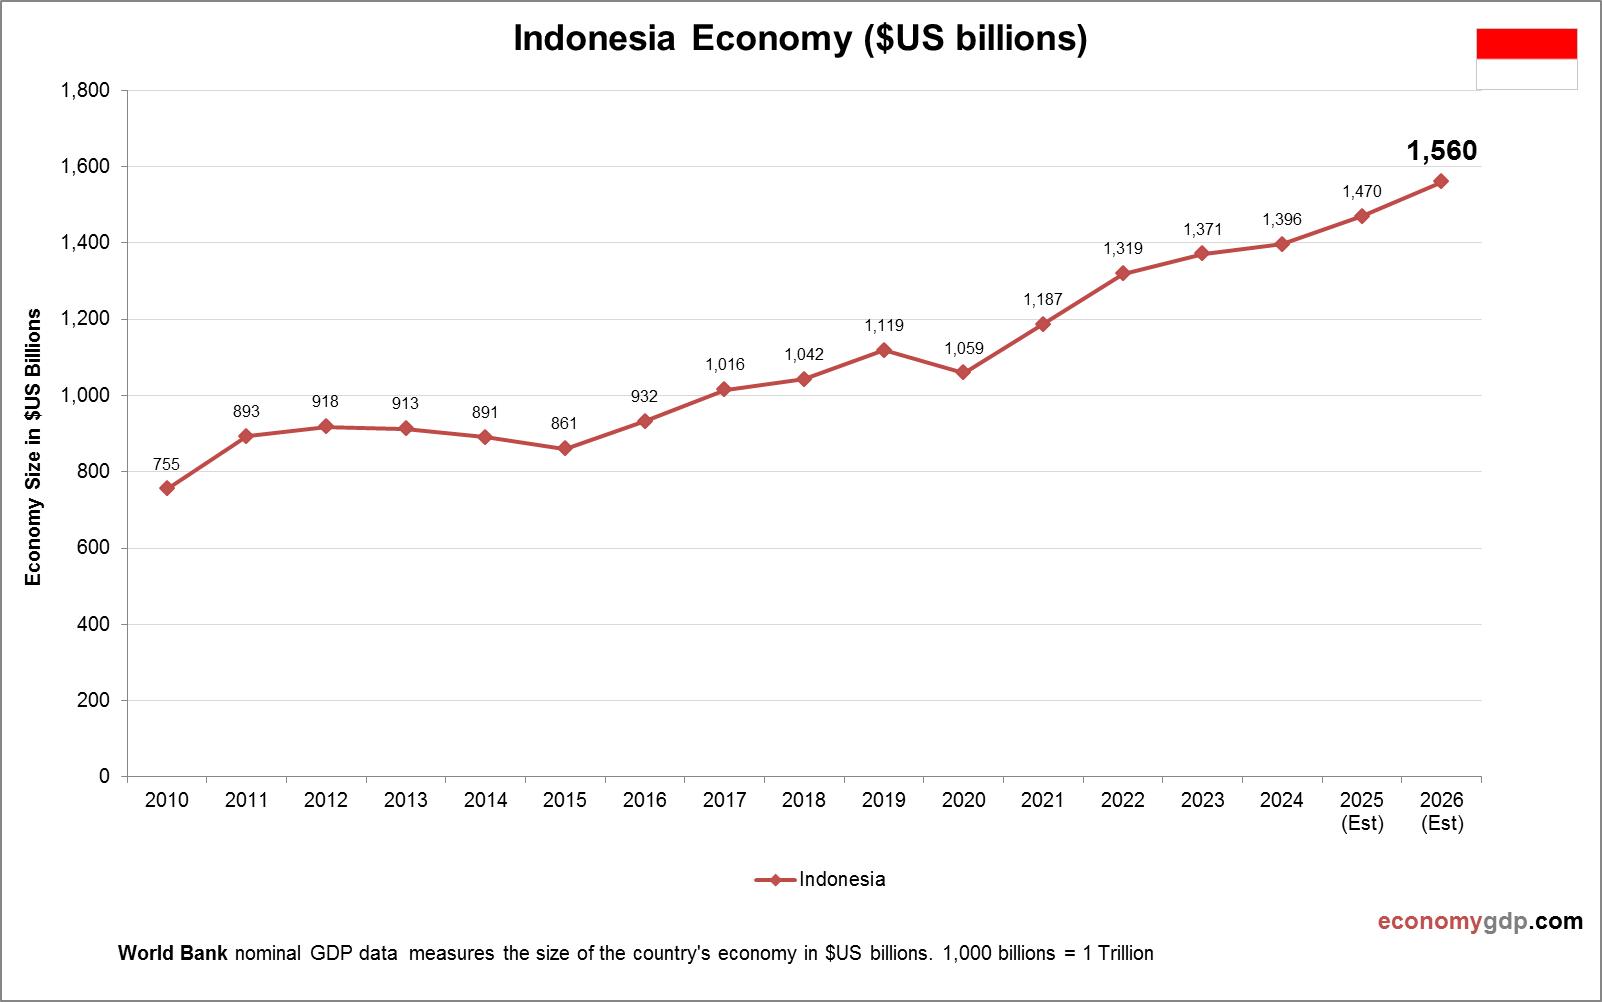
Indonesia Economy in Graphs
Indonesia’s economy relies on agriculture, mining, and manufacturing. Palm oil, rubber, and coffee dominate agricultural exports, while coal and nickel mining are significant. Manufacturing includes textiles and electronics. Emerging industries include digital economy, with e-commerce giants like Tokopedia, and green View diagram Indonesia Economy in Graphs