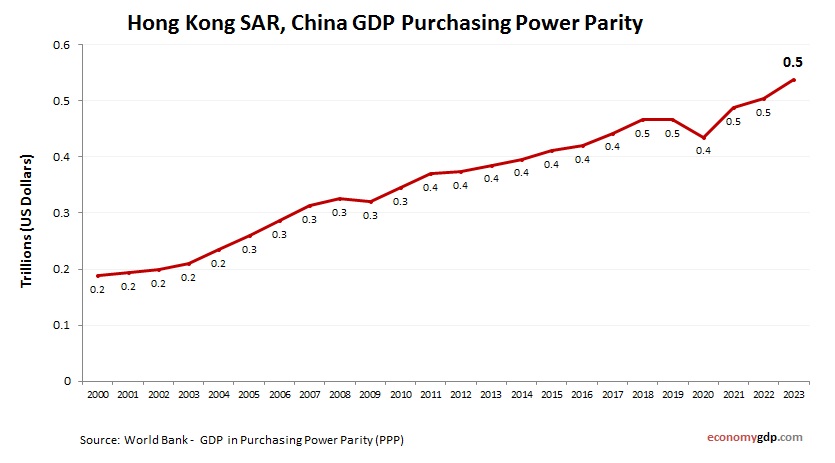
Skip to content
cropped-economygdp.jpg

Economy GDP

World economy charts, business frameworks and diagrams

Menu

Primary menu

  • Economy
    • Top Economies
  • Demographics
  • Business
    • Strategy
    • Project Management
    • Industry Examples
    • Leadership
    • HR
    • Industry Examples
  • Framework
  • Analysis
  • Lean Six Sigma
    • Lean
  • IT
    • Social Media
  • Marketing
  • Stories
  • Top

Tag Archives: hong kong

Hong Kong GDP PPP

Hong Kong GDP PPP

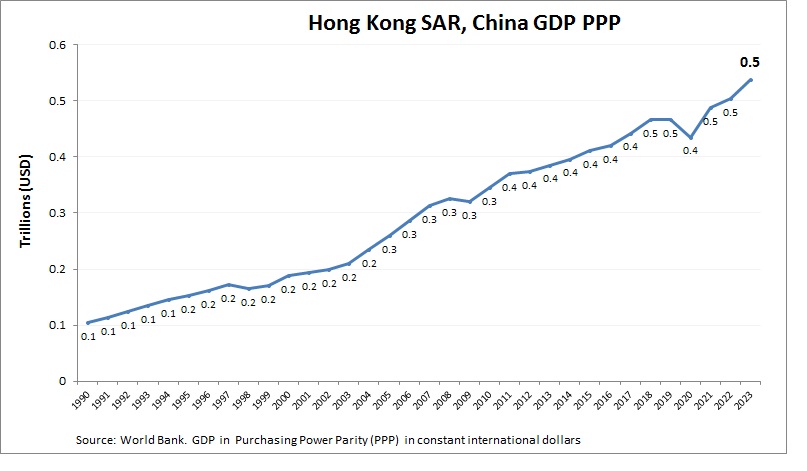
Hong Kong SAR, China economy graph showing purchasing power parity (PPP) growth from 1990 to today. Purchasing power parity adjusts the size of the economy to relevant price levels, i.e. measuring the price of specific goods in different countries and View diagram Hong Kong GDP PPP→

Posted in Economy | Tagged hong kong, hong kong economy, hong kong gdp

Hong Kong GDP growth rate

Hong Kong GDP growth rate

Hong Kong SAR, China economy annual growth rate from 2000 to today. GDP growth (yearly %). World Bank and OECD national accounts data. Hong Kong’s GDP grew by 3.5% in 2023, with a strong rebound in trade, tourism, and finance View diagram Hong Kong GDP growth rate→

Posted in Economy | Tagged hong kong, hong kong economy, hong kong gdp

Hong Kong SAR, China GDP

Hong Kong SAR, China GDP

Hong Kong SAR, China GDP from 1990 to today. World Bank and OECD data. GDP in US dollars. Hong Kong has a high-income economy known for finance, trade, and logistics. Its GDP is driven by open markets, low taxation, and View diagram Hong Kong SAR, China GDP→

Posted in Economy | Tagged hong kong, hong kong economy, hong kong gdp

Hong Kong SAR, China Economy

Hong Kong SAR, China Economy

Hong Kong SAR, China economy growth from 2000 to today. GDP (current US$). World Bank and OECD national accounts data. Hong Kong has a high-income economy built on finance, trade, and professional services. Its open-market policies and strategic global role View diagram Hong Kong SAR, China Economy→

Posted in Economy | Tagged hong kong, hong kong economy, hong kong gdp

Hong Kong GDP Purchasing Power Parity

Hong Kong GDP Purchasing Power Parity

Hong Kong SAR, China economy graph showing purchasing power parity (PPP) growth from 2000 to today. Purchasing power parity adjusts the size of the economy to relevant price levels, i.e. measuring the price of specific goods in different countries and View diagram Hong Kong GDP Purchasing Power Parity→

Posted in Economy | Tagged hong kong, hong kong economy, hong kong gdp

Primary Sidebar Widget Area

Top Diagrams

Latest Posts

  • Business Capabilities Model Explained
  • Paraguay GDP
  • Puerto Rico GDP per capita
  • Customer Segmentation Model
  • South Sudan GDP PPP
  • Paraguay GDP per capita
  • Tuvalu GDP per capita
  • Fraud Triangle
  • Togo GDP PPP
  • St. Kitts and Nevis GDP Purchasing Power Parity
  • AI Use Cases in Marketing Automation
  • Ukraine GDP
  • British East India Company 1600: Trade and Empire
  • Honduras Inflation
  • Macedonia GDP PPP
  • Twitter
Copyright © 2025 Economy GDP. All Rights Reserved.
Theme: Catch Box by Catch Themes
Scroll Up