Fragile and conflict affected situations Economy

Fragile and conflict affected situations Economy

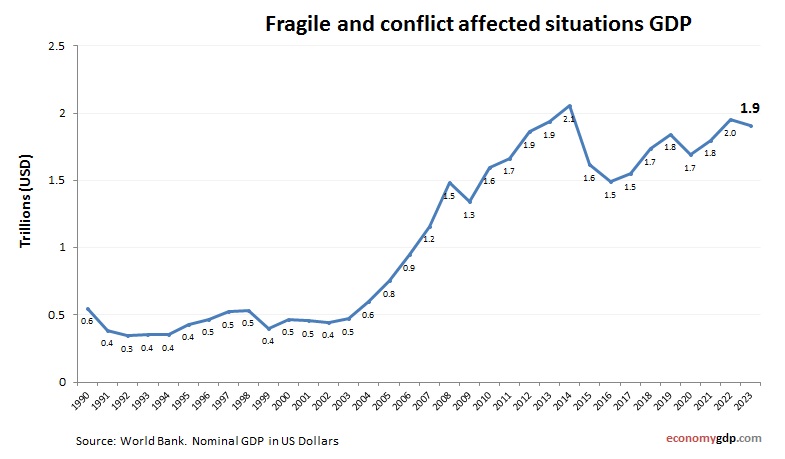
Fragile and conflict affected situations economy growth from 2000 to today. GDP (current US$). World Bank and OECD national accounts data. These economies suffer from instability and weak institutions, which severely limit GDP growth. Economic activity is often restricted to View diagram Fragile and conflict affected situations Economy

Fragile and conflict affected situations GDP growth rate

Fragile and conflict affected situations GDP growth rate

Fragile and conflict affected situations economy annual growth rate from 2000 to today. GDP growth (yearly %). World Bank and OECD national accounts data. These countries grew at about 3.0% in 2023. Growth was uneven, supported in some by reconstruction View diagram Fragile and conflict affected situations GDP growth rate

Fragile and conflict affected situations GDP Purchasing Power Parity

Fragile and conflict affected situations GDP Purchasing Power Parity

Fragile and conflict affected situations economy graph showing purchasing power parity (PPP) growth from 2000 to today. Purchasing power parity adjusts the size of the economy to relevant price levels, i.e. measuring the price of specific goods in different countries View diagram Fragile and conflict affected situations GDP Purchasing Power Parity

Fragile and conflict affected situations GDP PPP

Fragile and conflict affected situations GDP PPP

Fragile and conflict affected situations economy graph showing purchasing power parity (PPP) growth from 1990 to today. Purchasing power parity adjusts the size of the economy to relevant price levels, i.e. measuring the price of specific goods in different countries View diagram Fragile and conflict affected situations GDP PPP