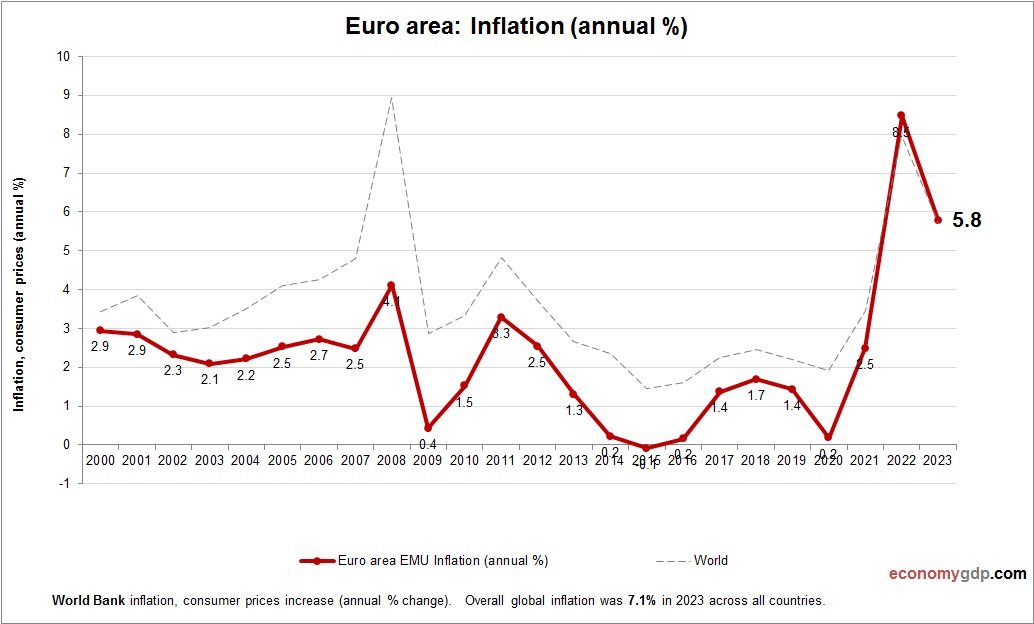
Skip to content
cropped-economygdp.jpg

Economy GDP

World economy charts, business frameworks and diagrams

Menu

Primary menu

  • Economy
    • Top Economies
  • Demographics
  • Business
    • Strategy
    • Project Management
    • Industry Examples
    • Leadership
    • HR
    • Industry Examples
  • Framework
  • Analysis
  • Lean Six Sigma
    • Lean
  • IT
    • Social Media
  • Marketing
  • Stories
  • Top

Tag Archives: Euro area economy

Posts tagged here examine the Euro area economy using comparative charts and visuals of GDP, PPP, inflation, and growth data from across member countries.

Euro area GDP

Euro area GDP

Euro area GDP from 2010 to today. World Bank and OECD data. GDP in US dollars. The Euro area's GDP encompasses the economies of countries using the euro currency, making it one of the largest global economic entities. Industry, services, View diagram Euro area GDP→

Posted in Economy | Tagged Euro area economy, Euro area gdp

Euro area GDP Purchasing Power Parity

Euro area GDP Purchasing Power Parity

Euro area economy graph showing purchasing power parity (PPP) growth from 2000 to today. Purchasing power parity adjusts the size of the economy to relevant price levels, i.e. measuring the price of specific goods in different countries and adjusting GDP View diagram Euro area GDP Purchasing Power Parity→

Posted in Economy | Tagged Euro area economy, Euro area gdp

Euro area Economy

Euro area Economy

The euro area economy consists of 20 EU countries that share the euro, forming one of the world's largest and most integrated economic blocs. It is driven by advanced manufacturing, extensive trade networks, and a strong services sector including finance, View diagram Euro area Economy→

Posted in Economy | Tagged Euro area economy, Euro area gdp

Euro area GDP PPP

Euro area GDP PPP

Euro area economy graph showing purchasing power parity (PPP) growth from 1990 to today. Purchasing power parity adjusts the size of the economy to relevant price levels, i.e. measuring the price of specific goods in different countries and adjusting GDP View diagram Euro area GDP PPP→

Posted in Economy | Tagged Euro area economy, Euro area gdp

Euro area GDP growth rate

Euro area GDP growth rate

Euro area economy annual growth rate from 2000 to today. GDP growth (yearly %). World Bank and OECD national accounts data. The Euro area experienced a GDP growth rate of 0.45% in 2023. The region faced stagnation, with zero growth View diagram Euro area GDP growth rate→

Posted in Economy | Tagged Euro area economy, Euro area gdp

Primary Sidebar Widget Area

Top Diagrams

Latest Posts

  • Business Capabilities Model Explained
  • Paraguay GDP
  • Puerto Rico GDP per capita
  • Customer Segmentation Model
  • South Sudan GDP PPP
  • Paraguay GDP per capita
  • Tuvalu GDP per capita
  • Fraud Triangle
  • Togo GDP PPP
  • St. Kitts and Nevis GDP Purchasing Power Parity
  • AI Use Cases in Marketing Automation
  • Ukraine GDP
  • British East India Company 1600: Trade and Empire
  • Honduras Inflation
  • Macedonia GDP PPP
  • Twitter
Copyright © 2025 Economy GDP. All Rights Reserved.
Theme: Catch Box by Catch Themes
Scroll Up