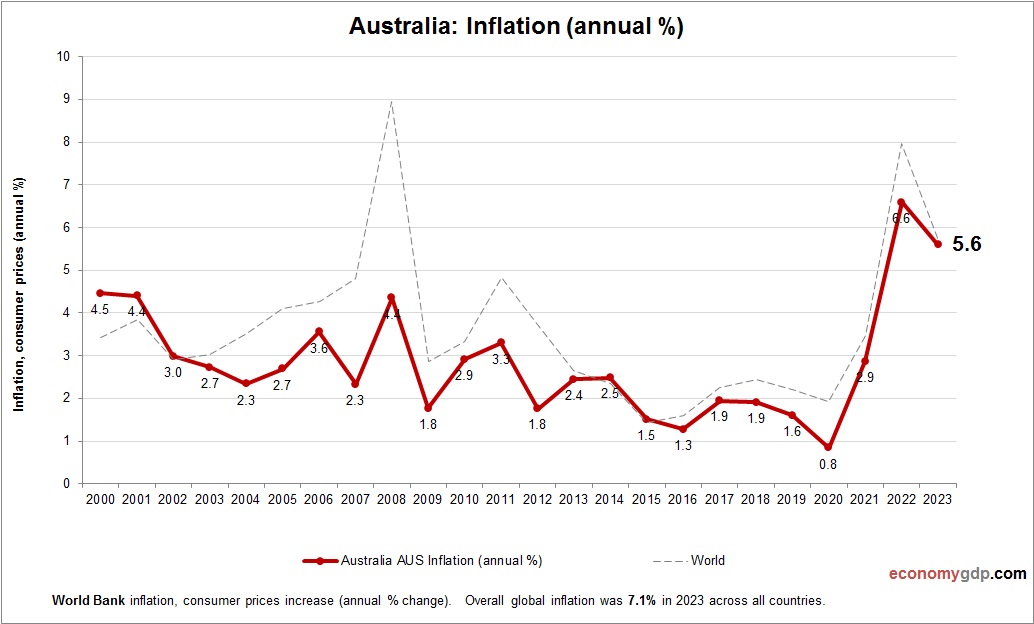
Skip to content
cropped-economygdp.jpg

Economy GDP

World economy charts, business frameworks and diagrams

Menu

Primary menu

  • Economy
    • Top Economies
  • Demographics
  • Business
    • Strategy
    • Project Management
    • Industry Examples
    • Leadership
    • HR
    • Industry Examples
  • Framework
  • Analysis
  • Lean Six Sigma
    • Lean
  • IT
    • Social Media
  • Marketing
  • Stories
  • Top

Tag Archives: Australia economy

Australia Economy in Graphs

Australia Economy in Graphs

Australia’s economy is driven by mining, agriculture, and services. Iron ore, coal, and natural gas exports dominate, with companies like BHP leading globally. Agriculture, including wheat and beef, is a key contributor. Services, particularly education and tourism, thrive in cities View diagram Australia Economy in Graphs→

Posted in Economy, Top Economies | Tagged Australia economy, Australia gdp

Australia GDP per capita

Australia GDP per capita

This diagram presents Australia GDP per capita. This is according to World Bank GDP stats by country. Latest GDP per person information for Australia. Australia’s GDP per capita is among the highest globally, reflecting its advanced economy characterized by a View diagram Australia GDP per capita→

Posted in Economy | Tagged Australia economy, Australia statistics

Australia GDP growth rate

Australia GDP growth rate

Australia economy annual growth rate from 2000 to today. GDP growth (yearly %). World Bank and OECD national accounts data. Australia recorded GDP growth of 2.3% in 2023. Mining, services, and real estate performed strongly, with net migration also supporting View diagram Australia GDP growth rate→

Posted in Economy | Tagged Australia economy, Australia gdp

Australia GDP

Australia GDP

Australia GDP from 2010 to today. World Bank and OECD data. GDP in US dollars. Australia's $1.8 trillion economy, growing 1.9% in 2025, thrives on mining, services, and agriculture, with per capita GDP at $55,000. Iron ore exports lead, while View diagram Australia GDP→

Posted in Economy | Tagged Australia economy, Australia gdp

Australia GDP Purchasing Power Parity

Australia GDP Purchasing Power Parity

Australia economy graph showing purchasing power parity (PPP) growth from 2000 to today. Purchasing power parity adjusts the size of the economy to relevant price levels, i.e. measuring the price of specific goods in different countries and adjusting GDP accordingly. View diagram Australia GDP Purchasing Power Parity→

Posted in Economy | Tagged Australia economy, Australia gdp

Australia GDP PPP

Australia GDP PPP

Australia economy graph showing purchasing power parity (PPP) growth from 1990 to today. Purchasing power parity adjusts the size of the economy to relevant price levels, i.e. measuring the price of specific goods in different countries and adjusting GDP accordingly. View diagram Australia GDP PPP→

Posted in Economy | Tagged Australia economy, Australia gdp

Australia Economy

Australia Economy

Australia's economy is resource-rich and highly developed, supported by significant exports of iron ore, coal, and natural gas to key Asian markets. The country also has a large services sector that includes finance, tourism, education, and health care. Agriculture remains View diagram Australia Economy→

Posted in Economy | Tagged Australia economy, Australia gdp

Primary Sidebar Widget Area

Top Diagrams

Latest Posts

  • Paraguay GDP
  • Puerto Rico GDP per capita
  • Customer Segmentation Model
  • South Sudan GDP PPP
  • Paraguay GDP per capita
  • Tuvalu GDP per capita
  • Fraud Triangle
  • Togo GDP PPP
  • St. Kitts and Nevis GDP Purchasing Power Parity
  • AI Use Cases in Marketing Automation
  • Ukraine GDP
  • British East India Company 1600: Trade and Empire
  • Honduras Inflation
  • Macedonia GDP PPP
  • Top 100 World Economies
  • Twitter
Copyright © 2025 Economy GDP. All Rights Reserved.
Theme: Catch Box by Catch Themes
Scroll Up