Generative AI Use Cases
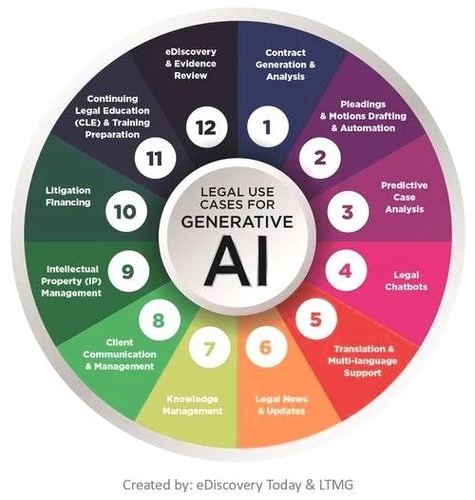
Generative AI Use Cases: Generative AI use cases demonstrate how AI can create new content, solve problems, and automate tasks. In marketing, AI might generate personalized email campaigns. In entertainment, it could create new music or video content. In healthcare, View diagram Generative AI Use Cases