
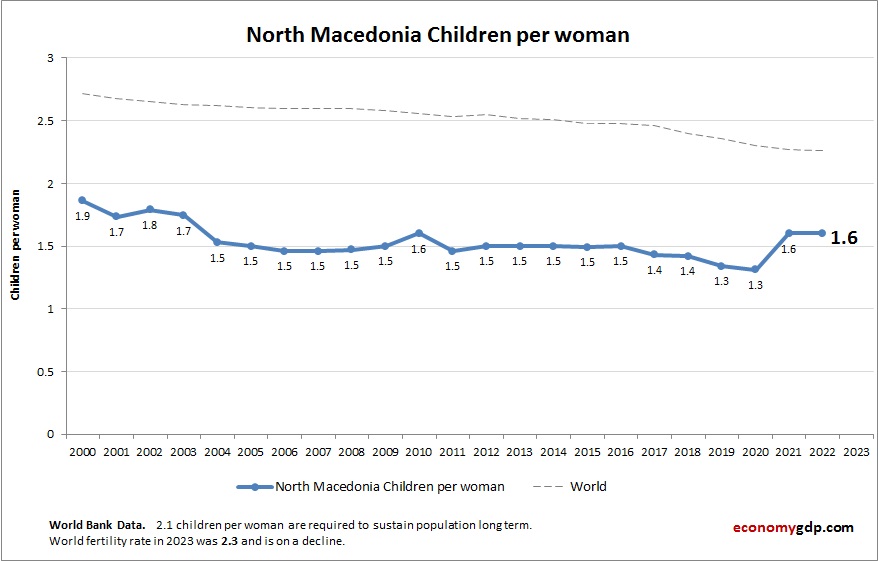
This diagram show Macedonia children per woman. The fertility rate statistics are compiled by Worldbank based on the latest demographics stats.
Macedonia Children Per woman (Fertility Rate) Statistics by Year
| Year | Children per woman (fertility rate) |
| 2000 | 1.86 |
| 2001 | 1.73 |
| 2002 | 1.79 |
| 2003 | 1.75 |
| 2004 | 1.52 |
| 2005 | 1.50 |
| 2006 | 1.46 |
| 2007 | 1.46 |
| 2008 | 1.47 |
| 2009 | 1.50 |
| 2010 | 1.60 |
| 2011 | 1.46 |
| 2012 | 1.50 |
| 2013 | 1.50 |
| 2014 | 1.50 |
| 2015 | 1.49 |
| 2016 | 1.50 |
| 2017 | 1.43 |
| 2018 | 1.42 |
| 2019 | 1.34 |
| 2020 | 1.31 |
| 2021 | 1.60 |
| 2022 | 1.60 |
| 2023 | 1.50 |
| 2024 | 1.40 |
| 2025 (Est.) | 1.40 |
| 2026 (Est.) | 1.40 |