
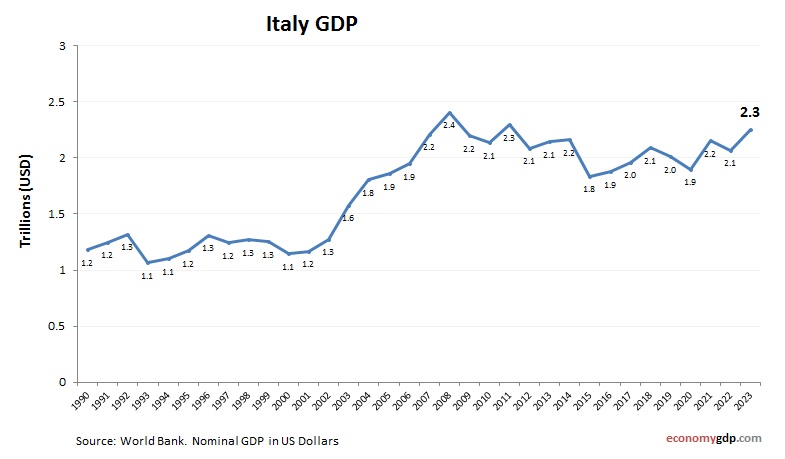
Italy GDP from 2010 to today. World Bank and OECD data. GDP in US dollars. Italy's GDP is driven by a diverse economy rooted in advanced manufacturing, luxury goods, tourism, and agriculture. Northern regions are highly industrialized, producing automobiles, machinery, and fashion, while the south focuses more on agriculture. Italy is one of the world's largest exporters of wine and olive oil, as well as high-end fashion and design. Services, including banking and tourism, are also vital to economic output. Italy faces challenges with high public debt and slow growth but remains a key member of the Eurozone, with strong global influence in culture, food, and industrial production.
Italy GDP Statistics by Year
| Year | GDP Size (in billions $) |
| 2025 (projected) | 2,450 |
| 2024 | 2,373 |
| 2023 | 2,305 |
| 2022 | 2,104 |
| 2021 | 2,179 |
| 2020 | 1,907 |
| 2019 | 2,020 |
| 2018 | 2,099 |
| 2017 | 1,971 |
| 2016 | 1,887 |
| 2015 | 1,845 |
| 2014 | 2,173 |
| 2013 | 2,153 |
| 2012 | 2,098 |
| 2011 | 2,307 |
| 2010 | 2,145 |